


Statistical Analysis of Derry v Down

Throughout the 2013 Ulster Senior Championship, Ulster GAA will be compiling a report of the key statistics from each match. The reports will look at a range of factors contributing to game play, including possession breakdown, kick out success, possession to scores ratios and turnover stats.
The purpose of this project is to identify the key differences between team performance, and possibly help pin point where the key differences existed. Ultimately, it is hoped to identify the key area each team needs to address ahead of their next championship outing in 2013.
Ball in Play
During the first 2 weeks of the provincial championship one of the more striking observations was that ‘active’ game time had averaged 42% of total game time, which equated to somewhere between 30 and 33 minutes. On a more positive note, the Derry v Down quarter final had 38 minutes and 5 seconds of active game time, which calculated as 52% of total game time (Figure 1). Despite the more positive findings from this game we still must take note that the average active game time remains around 45% or 33 minutes and 30 seconds; less than one full half of a 70 minute match.
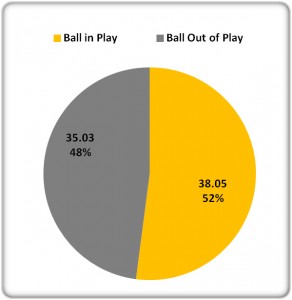
Figure 1: Active Game Time
Possession
The Ulster Championship of 2013 has, so far, rubbished the notion that superior possession is key to success, with both Cavan and Donegal winning despite having an inferior share of possession. On first view, and when looking at the match as a whole, this week’s fixture added further weight to this argument, with Down securing the lowest percentage share of possession of any team so far in the USFC 2013, with just 45.5%, when compared to Derry’s 54.5% (Figure 2).
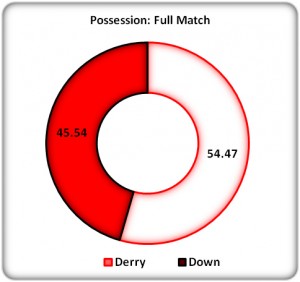
Figure 2: Full Match Possession
This game also followed the previous pattern of the USFC matches, in that Derry enjoyed a 4 point lead at half time (1-10 to 0-09), while also having secured a greater share of possession in the first half. In fact, during the first half of this match Derry secured almost 62% of possession, compared to Down’s 38% (Figure 3). To date, this is the highest margin there has been in possession share during the USFC. Despite this advantage, Derry had only scored twice more than Down; a factor that became apparent in the second half.
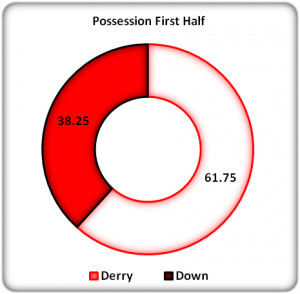
Figure 3: 1st Half Possession
In keeping with previous matches, the team leading at half time appeared to concede a greater possession share to their opponents, with Down enjoying 53% of possession in the second half, compared to Derry’s 47% (Figure 4). However, the major difference witnessed during this match was that Derry were unable to consolidate their half time superiority on the scoreboard, with Down outscoring them by 2-08 to 0-05 in the 2nd half.
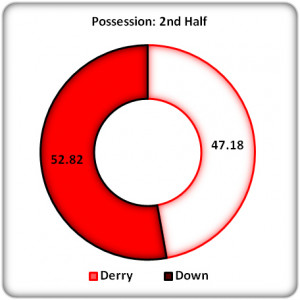
Figure 4: 2nd Half Possession
While our overall possession statistic supports our argument that possession is irrelevant when determining the outcome, it is important to take note of the distinct statistics for each half. The team who had more possession in each half, enjoyed superiority on the scoreboard in the respective half. This has provided a timely reminder of the importance of possession; however, the overall possession stats further highlighted the importance of efficiency when in possession, with Down proving much more potent when enjoying the superior possession share.
Figure 5 provides a very interesting model to highlight our possession stats from the USFC 2013 so far. Despite having less possession over the course of the game, Cavan, Donegal and Down have all won their opening championship matches.
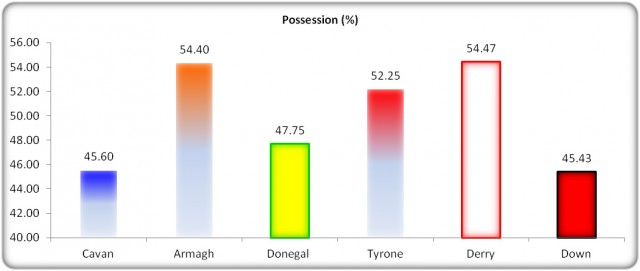
Figure 5: USFC 2013 Possession (%)
Kick Outs
To date, the kick out possession has been ‘won’ by the teams who were ultimately unsuccessful, Armagh and Tyrone. This game provided an obvious shift in kick out strategy. This was the first game of the USFC where both teams were willing to, and in many cases seeking out the short kick out. It was interesting to note that both teams employed a sweeper system, which resulted in 2 extra players in their defensive zone, thus providing the goalkeepers with more opportunity to complete a successful short kick out. This was also the first game of the championship where the winning team, Down, also secured more primary possession from kick outs. They secured 30 primary possessions, exactly 50% more than Derry, who secured 20 (Figure 6). The half by half kick out breakdown showed little or no correlation with the possession statistics. Despite having 62% of possession in the first half, Derry only won 38% of the kick outs in this half. Again, this perhaps raises the question as to the importance of securing primary possession.

Figure 6: Kick Out Possession
Given the obvious employment of the short kick out it seemed appropriate to observe the breakdown of the kick outs during this match. Figure 7 provides an excellent graphical demonstration of how Down were superior in this area, with their ability to win break ball from the Derry kick out the ultimate difference between the teams. Overall, Down were able to secure 8 more primary possessions through break ball. It is also notable that 40% of the kick outs taken were ‘short’ kick outs.
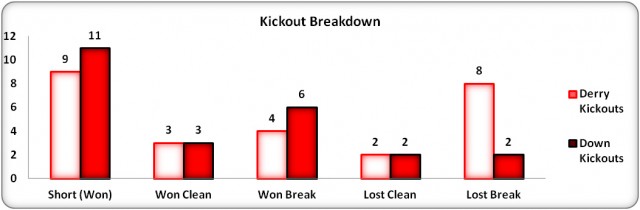
Figure 7: Kick Out Breakdown
Possession to Scores Ratios
As with previous weeks, Derry had the superior share of possession over the course of the match, but failed to win the game. As with Armagh and Tyrone previously, they were unable to convert the possession to the scores required to win the game.
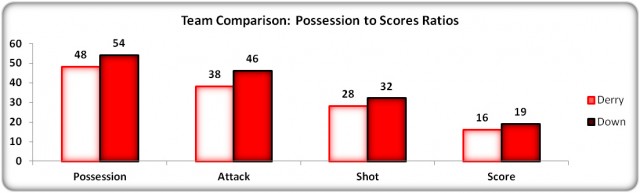
Figure 8: Possession to Scores Ratios
Interestingly, despite having a greater share of possession, Derry had 6 fewer possessions over the course of the match when compared to Down; Derry – 48, Down 54 (figure 8). Both teams were able to convert possession to attacks frequently, with Down converting 85% of possessions to attacks; the highest figure so far in the USFC. Derry also converted an impressive 79% of possessions to attacks. This trend also carried through to creating shooting chances, with Down creating shooting chances from 59% of all their possessions, closely compared to Derry with 58%. There were also marginal differences in terms of scoring ratio from possessions; Down – 35%, Derry – 33%. As demonstrated in figure 9, these conversion rates are the best witnessed so far in the USFC 2013. However, it is still difficult to clearly identify where the key difference existed between Derry and Down.
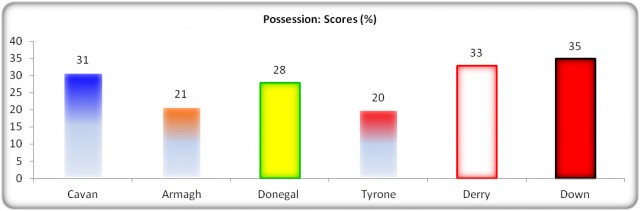
Figure 9: Possession: Scores (% Success)
As previously alluded to, Derry had a greater possession share, but fewer overall occasions in possession, clearly demonstrating that they had a higher average possession time (Figure 10).
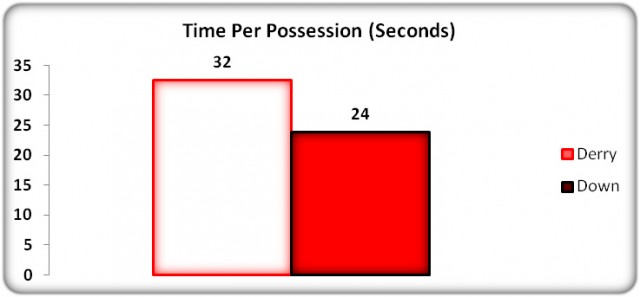
Figure 10: Average Possession Time
It is fair to suggest that the speed and incision with which Down mounted their attacks may have contributed to their victory. Despite having less time in possession of the ball, they were able to secure more possessions, mount a greater volume of attacks, create more scoring chances and ultimately deliver more scores.
Turnovers
The turnover statistics followed the pattern of most of the previous statistics from this match, in that there was minimal obvious difference. It is interesting in that the turnover profile of this game is almost identical to that of the Donegal v Tyrone match the previous week. The only notable difference being that there were twice as many possessions lost in the tackle during the Donegal v Tyrone match (12), when compared to this week’s match (6).
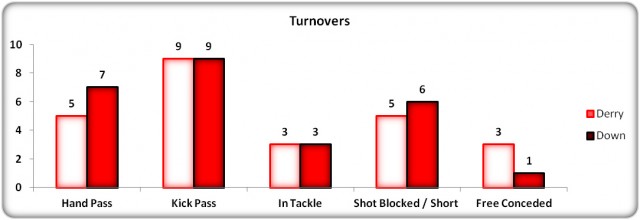
Figure 11: Turnover Statistics
The turnover statistics from this game were very similar to the previous games, with Cavan continuing to be the standout performer with only 15 turnovers (Figure 12).
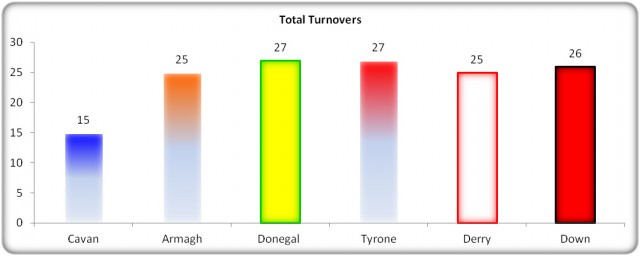
Figure 12: USFC 2013 Turnover Comparison
Summary
In summary, once again this week dominance in possession did not prove to be significant in terms of overall outcome. However, it is important to note that possession dominance in each half did translate to scoreboard success. On a more positive note from the previous week we had over 50% of ‘active’ game time, which, while still quite low, is an improvement on a previous average of just 42%. While the previous games had demonstrated clear differences between the teams, the statistics on this game have struggled to identify an obvious difference. There is a suggestion that the volume of possession is less important than the number of possessions, and in turn the speed and incision that a team can offer when in possession.
Derry
On the basis of the statistics Derry have little other than the outcome to be overly disappointed with. When observing the statistics on a standalone basis they may identify their own kick outs as a cause for concern, given that they lost 38% of their own kick outs, when compared to Down, who only lost 17% of their own kick outs. However, when looking at the statistics collectively these kick out stats appeared to have little bearing on the possession share. Where the key difference may lie, may be in the average length of time in possession, which would suggest that Derry were content to opt for a patient, slow build up more often than their opponents. Further review of video footage may highlight that the high intensity, incisive attacks were more likely to deliver scores.
Down
Down will have been very happy with the result, and looking at the statistics will probably feel they delivered an overall solid performance. However, if you think back to last week’s match; Donegal only converted 67% of possession to attacks and 40% to shots, but were able to convert a massive 71% of shots to scores. Derry were allowed to convert 79% of possessions to attacks, and 58% of possessions to shots. If we combine these statistics, and Down continue to allow Donegal to create plentiful scoring chances it is likely that Donegal will convert a very high percentage of these attempts and could score quite heavily. Down may choose to address their ability to press the opposition early / high up the pitch in an attempt to lower the rate with which they can create scoring chances.
USFC 2013 Semi Final Preview: Donegal v Down
With both teams having played their Quarter Final we are now in a position to have a look at what the statistics may tell us ahead of the meeting of Donegal and Down. Both teams conceded the superior portion of possession to their quarter final opponents, however, Down enjoyed 54 possessions over the course of their match, compared to 43 that Donegal secured against Tyrone. In terms of their rates of conversion of possessions and their success rate of shots we can speculate as to which team may enjoy greatest success on the scoring front. On the basis that each team secures 50 possessions we could speculate the following;
If Down secure 50 possessions, Donegal will allow them to build 42 attacks, from which they will create 28 scoring chances and convert 16 scores.
If Donegal secure 50 possessions, Down will allow them to generate 40 attacks, from which they will create 29 scoring chances, but they will convert 20 scores if they maintain their shot success rate from the quarter final.
The key, based on what we have observed to date may not be in the volume of possession secured, but in the number of possessions secured by each team.
Based on their quarter final displays both teams have produced some impressive statistics; Donegal converting 71% of their scoring attempts, while Down converted a championship leading 35% of all possessions to scores. These highly impressive attacking stats hopefully suggest a match with some very high quality attacking skills on display, while also presenting an intriguing build up in terms of how each team will deploy their players defensively to combat their opponent’s attacking ability.
For further information please contact Kevin McGuigan on kevin.mcguigan.ulster@gaa.ie