

Statistical Analysis of Cavan v Monaghan
Throughout the 2013 Ulster Senior Championship, Ulster GAA will be compiling a report of the key statistics from each match. The reports will look at a range of factors contributing to game play, including possession breakdown, kick out success, possession to scores ratios and turnover stats.
The purpose of this project is to identify the key differences between team performance, and possibly help pin point where the key differences existed. Ultimately, it is hoped to identify the key area each team needs to address ahead of their next championship outing in 2013.
Ball in Play
In our penultimate match of the USFC 2013, and the second semi final, our statistics largely reinforce the trends that have been evident in the championship to date. One of the most striking trends witnessed on a weekly basis has been the limited amount of time the ball was actually in play. Unsurprisingly this trend continued in this game, with only 48% of total game time considered to be active (Figure 1A). Figure 1B also allows us to compare active time on a half by half basis. It is clear that there was more inactive time in the second half. A potential reason for this may correlate with the volume of scores that were taken from free kicks. There were only 3 scoring free kicks in the first half, while there were 7 in the second half. Free takers ‘taking their time’ is clearly having a significant impact upon the volume of active game time.
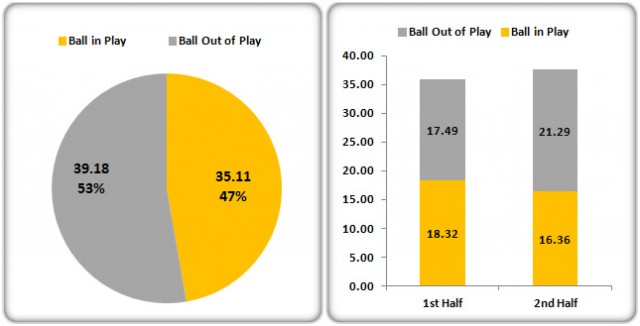
Figure 1A & 1B: Active Game Time
Possession
Once again, and indeed for the 6th game from the 7 played thus far, the team who had least possession emerged victorious. Had our possession statistics been available at half time, it would have been worrying from a Cavan perspective. Despite enjoying a massive advantage in possession share (61%), the teams were level at half time (Figure 2). On the other hand, Monaghan will have been concerned with only securing 39% of possession, but also satisfied that they were able to convert enough chances to remain on a par with Cavan in terms of score line.
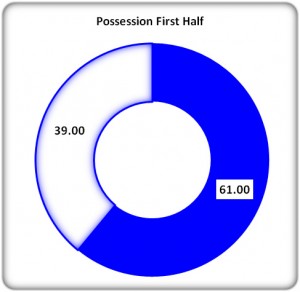
Figure 2: 1st Half Possession
In the second half Monaghan were able to turn around the possession and ultimately do enough to secure the win, albeit by the smallest of margins (Figure 3).
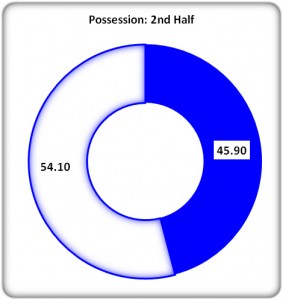
Figure 3: 2nd Half Possession
Over the course of the full match (figure 4), Cavan enjoyed more possession. Ironically, of the 3 matches Cavan have been involved in, this was the first game they have had more possession than their opponent, but was also the first match in which they have been defeated.
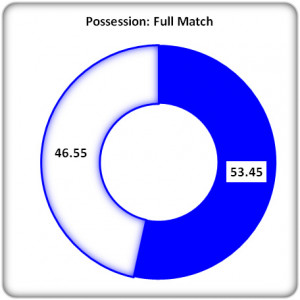
Figure 4: Full Match Possession
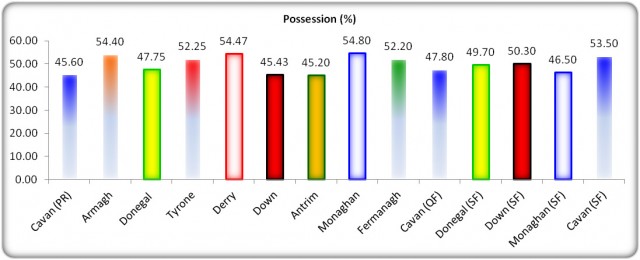
Figure 5: USFC 2013 Possession (%)
To date in the USFC 2013, only Monaghan (v Antrim) have won the match having enjoyed the greater share of possession. Cavan and Down in particular have provided us with a very interesting fact in terms of possession share. In the games where they enjoyed less possession they emerged victorious, yet when they did secure more possession than their opponents they suffered defeat. Does this tell us that a team’s chance of success lies within their ability to contain their opponent?
Kick Outs
Figure 6 depicts how Cavan managed to significantly improve on their ability to win possession from kick outs (27) when compared to their previous games. This also correlated with the possession advantage they enjoyed over Monaghan. However, this also throws up yet another startling statistic from Cavan. In previous games they were comprehensively beaten in terms of kick outs won, but won both games regardless. However, in this game they won significantly more kick outs than Monaghan, but suffered defeat. The pattern displayed by Cavan throughout the championship, in terms of possession and ability to win kick outs, is in contrast to some of the concepts that have long been accepted as central to a team’s chances of success in Gaelic football; 1) Ability to win ball from kick outs; & 2) Ability to keep possession.
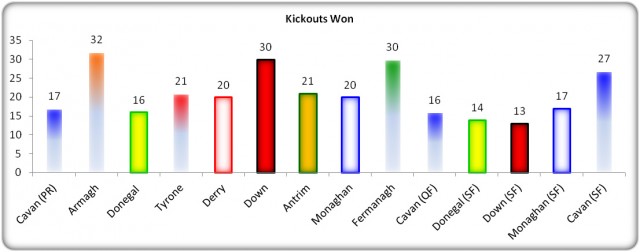
Figure 6: Kick Out Possession – USFC 2013
Regardless of any patterns we are witnessing, Monaghan will be eager to address any issues regarding kick outs ahead of the Ulster final, therefore it is vital that they identify why and where Cavan were superior over the course of the game.
Figure 7 provides a very clear demonstration of where Monaghan struggled with kick out possession. Despite winning more clean possession than Cavan (Monaghan – 8, Cavan – 2), they were comprehensively out fought for break ball, with Cavan winning 22 compared to just 8 for Monaghan. This will be one of the primary areas that Monaghan are likely to identify to improve ahead of the Ulster final on 21st July.
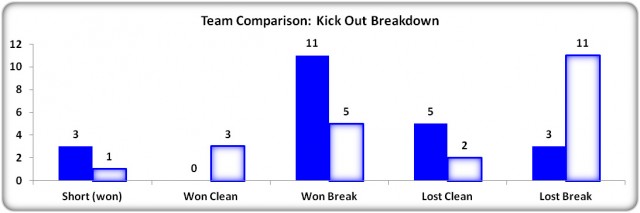
Figure 7: Kick Out Breakdown
Possession to Scores Ratios
In keeping with the possession and kick out stats, Cavan secured more possessions (45) over the course of the match than Monaghan (40). However, as can be seen from figure 7, Monaghan were able to convert 83% of their possessions to attacks, while Cavan could only convert 71% to attacks.
An almost identical pattern was evident when working the scoring opportunity from their attacks, with Cavan only creating shooting chances from 72% of their attacks, while Monaghan created shooting opportunities from 82% of their attacks.
The main reason Cavan were able to remain in contention until the final whistle most likely lay in the fact that they were more efficient at finishing than Monaghan. Cavan finished 52% of their 23 scoring attempts, while Monaghan were only successful with 41% of their attempts.
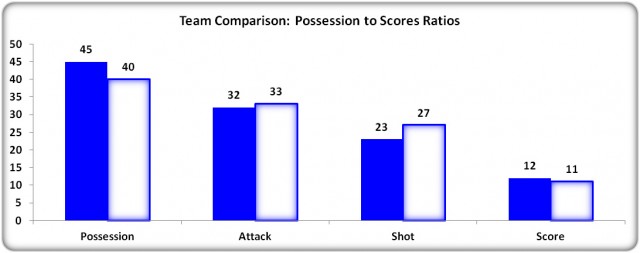
Figure 8: Possession to Scores Ratios
While our initial stats on possession and kick outs would point towards a Cavan victory, the possession conversion statistics above would point towards a Monaghan victory. The ultimate difference lay in the fact that Monaghan displayed a marginally superior possession to score conversion rate (Figure 9). Monaghan converted 28% of possessions to scores, just 1% greater than the conversion rate displayed by Cavan (27%).
Monaghan will be satisfied that they were able to significantly improve upon their conversion rate since the Antrim game (20%), while Cavan’s lack of improvement in this rate ultimately cost them a victory in this match.
Both teams should take solace from the fact that, with the exception of the Down Derry quarter final, this match provided the highest rate of conversion of possessions to scores.
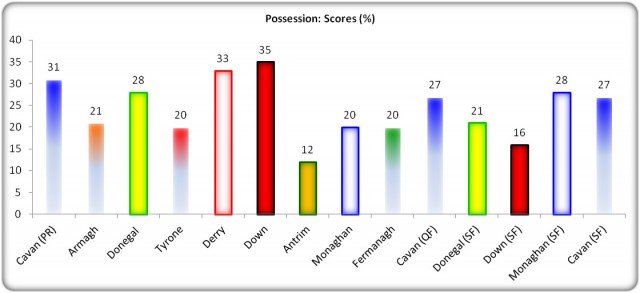
Figure 9: Possession: Scores (% Success)
Turnovers
Last week’s meeting between Donegal and Down had 88 turnovers almost evenly split between the teams but this volume of turnovers is unlikely to be repeated, and indeed this match witnessed a drop to well below the average number of turnovers with just 39 in the match (Monaghan – 17, Cavan – 22). Both Cavan and Monaghan will be reasonably happy with the volume of possessions they lost. However, both will feel they could have put more pressure on the other and forced more turnovers, in particular Cavan, who had forced 35 turnovers in their previous match against Fermanagh.
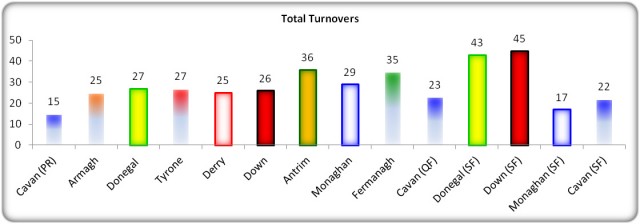
Figure 10: Turnover Comparison USFC 2013
Overall, Monaghan will be satisfied with their performance, with no area proving overly problematic in terms of lost possession. Cavan will likely be slightly concerned with their pass selection, with 16 attempted passes resulting in lost possession.
Looking forward, Monaghan will have to pay attention to the volume of turnovers in the tackle evident in the Donegal Down match before they line out against Donegal in the Ulster final. In that match Donegal turned Down over 11 times in the tackle, which would point towards an intensity of tackling and closing down that Monaghan have yet to encounter during the 2013 season.
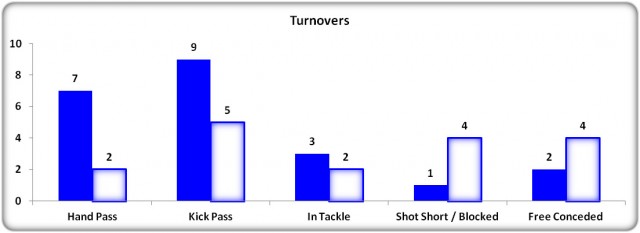
Figure 11: Monaghan v Cavan Turnover Comparison
Summary
On the scoreboard this game was the closest we have witnessed yet during the USFC 2013. However unlike the Donegal Down semi final there were discreet differences in the underlying statistics, with both teams superior in different areas of the match. In effect the areas of superiority cancelled one another out and resulted in the game coming down the finest margin possible.
Cavan enjoyed dominance in terms of kick out success and overall possession share but Monaghan were more effective at creating attacks and scoring chances than Cavan. The advantage of this type of analysis is that both teams will be able to identify a few key areas to work on ahead of their next outing in the championship.
Cavan
It is ironic that having improved upon their biggest area of weakness from their first 2 matches that Cavan then found themselves suffering defeat. However, they can take a huge positive from the fact that they were able to outperform Monaghan from kick outs. What they will want to focus on is their use of this possession, and more specifically their ability to generate scoring chances when they do gain possession.
They will point towards the 16 possessions lost via their passing, either by foot or hand as one of the key stumbling blocks in the process of creating chances. Some focussed work on their decision making and execution of passing will hopefully allow them to improve upon their ability to work the ball into the areas and the players who can take the scores. Given that Cavan were more clinical with their scoring attempts than Monaghan, it is imperative that they work extensively on the movement of possession into the correct areas in the hope of maintaining their shot success rate.
Monaghan
Monaghan will be delighted to make the Ulster final, but will be under no illusions as to the challenge that lies ahead. They will accept that they defeated Cavan without producing any exceptional underlying statistics, and indeed performed very poorly when compared to Cavan in certain areas of this game.
They will be happy that despite their limited possession they were able to create more scoring chances than Cavan, however, their success rate from these attempts (41%) is an area they will need to improve on. When we consider that Donegal have delivered a success rate from shots of over 70% in both games so far it puts into perspective how important it is that Monaghan improve their own success rate when they do get the chance.
The other area that stood out in this game was the lack of break ball that Monaghan were able to secure. They were out fought 22 to 8 in terms of break ball. While we have demonstrated that this is not necessarily an indicator of success, it stands to sense that Monaghan will need to limit the possession conceded to Donegal in order to prevent them creating the scoring chances and therefore increasing the volume of break ball won would appear vital to their chances of success.