

Statistical Analysis of Derry v Donegal
Throughout the 2014 Ulster Senior Championship, Ulster GAA will be compiling a report of the key statistics from each match. The reports will look at a range of factors contributing to game play, including possession breakdown, kick out success, possession to scores ratios and turnover stats.
The purpose of this project is to identify the key differences between team performance, and possibly help pin point where the key differences existed. Ultimately, it is hoped to identify the key area each team needs to address ahead of their next championship outing in 2014.
Ball in Play
The first quarter final clash of the 2014 Ulster Championship was, as expected, a close fought battle between Derry and Donegal. The following analysis of the important match stats will help to decipher where and how the game was won and lost.
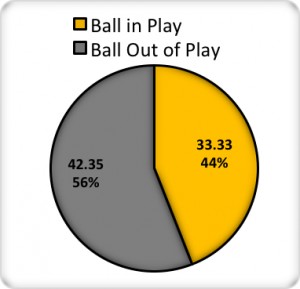
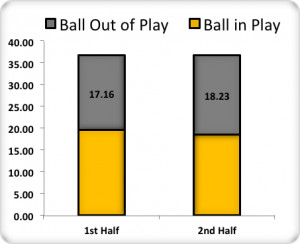
There was no change to the already well established pattern of active game time, with this, the third game of the Ulster Championship, yet again providing an active game time of 44% of the total game time (Figure 1A).
Figure 1A & 1B: Active Game Time
Possession
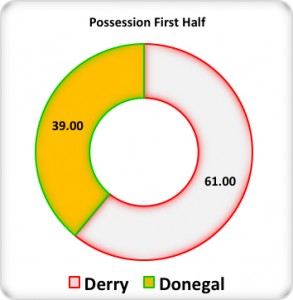
The battle for the ball was interesting. With Derry leading at half time, the expectation would be that they had enjoyed more possession. This proved to be the case, with Derry claiming 61% of the possession in the first half, 22% more than Donegal on 39% (Figure 2A). While Derry could be contented with controlling such a significant share of possession there would certainly be cause for concern given that this dominance only translated to a 2 point half time lead. On the other hand, while being concerned about sacrificing such a share of possession, Donegal will see the deficit of only 2 points as a major positive. For Donegal, the obvious half time advice would have been that a greater share of possession should result in a more successful second period.
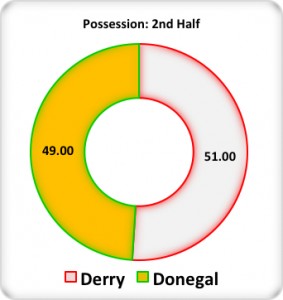
This is exactly how the game transpired, with Donegal balancing the share of possession in the second half, 49% compared to Derry’s 51%. Their increased share of possession resulted in a 5 point swing, with the 2 point half time deficit being overhauled to result in a 3 point victory.
Figure 2A & 2B: 1st & 2nd Half Possession
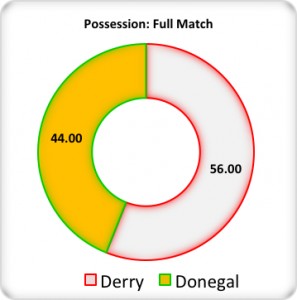
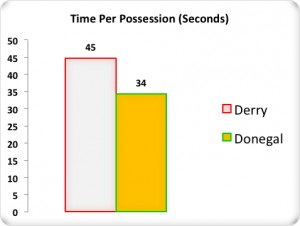
Over 70 minutes, Derry enjoyed 56% of total possession (Figure 3). This is a pattern we witnessed a lot throughout 2013, with the eventual losing team enjoying more possession. There are a couple of potential reasons this pattern emerges. In this instance it appeared to be due to Donegal’s tactic of containment followed by fast, direct counter attacking, whereas Derry were using a more patient build up. These contrasting approaches are summarised in figure 4, with Donegal’s average time in possession 11 seconds less than Derry. It is fair to say that the key to this tactic for Donegal is that they are leading the match, and can afford the time to contain the opposition, and ultimately sacrifice possession for lengthy spells. During the early stages of the second half Donegal dominated possession and delivered sufficient scores to lead the match, and therefore were able to apply this approach thereafter.
Figure 3A & 3B: Full Match Possession & Average Time per Possession
Kick Out Statistics
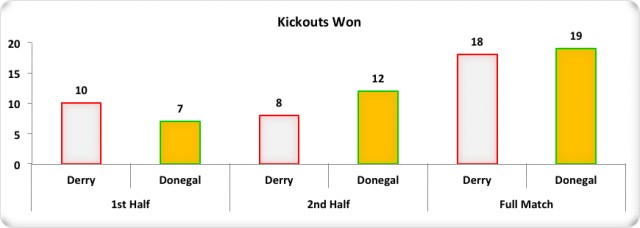
Donegal’s early dominance of the second half was evident in the overall kick out statistics, where they managed to reverse the trend seen in the first half. Derry had only 6 kick outs in the first half, all of which they won, and indeed 5 of these were won clean. However, in the second half Donegal won 7 from 12 of Derry’s kick outs, all of which were through break ball. There was an obvious focus placed upon contesting Derry kick outs in the second half in order to gain more possession and this focus paid off on the scoreboard very early on.
Figure 4: Kick Outs Won
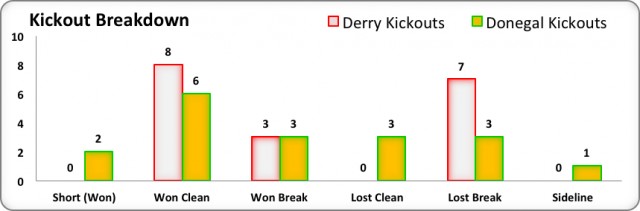
This game provided a different set of stats in terms of kick out breakdown (Figure 5). In most recent games the predominant method of winning kick outs is through break ball, or occasionally through short kick outs. However, in this game there was more ball won clean from kick outs than any other method, with Derry winning 8, and Donegal 6. As a foot note, the first 9 kick outs in this match were all won clean in the middle third of the pitch. Derry lost 7 of their own kick outs to break ball, all of which came during the 10-15 period following half time.
Figure 5: Kick Out Breakdown
Turnovers
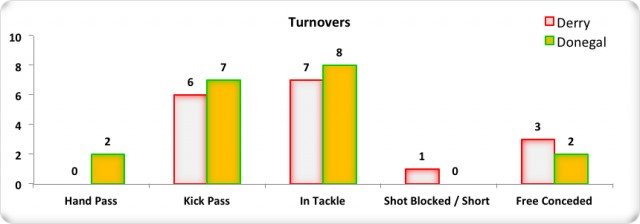
In our two previous Ulster championship matches of 2014, we have seen an average turnover count of 26 per team per match. In this game Derry lost possession 17 times, and Donegal 19 times (Figure 6). Both teams appear to have been very effective at retaining possession. Neither will be looking at their own turnover count with any degree of concern, but both may feel they should be doing more to force their opponents into mistakes. Both teams were very secure in their hand passing, with Donegal only losing possession twice through hand passing, and Derry not registering a single turnover via the hand pass.
Figure 6: Turnovers
Possession to Scores Ratios
Thus far we have yet to establish any real difference between the 2 teams statistically. In fact, at this stage statistically, Derry hold a marginal advantage in terms of possessions and turnover counts. At this stage it is vital to assess the effectiveness of each team in possession.
Figure 7: Possession to Scores Ratios
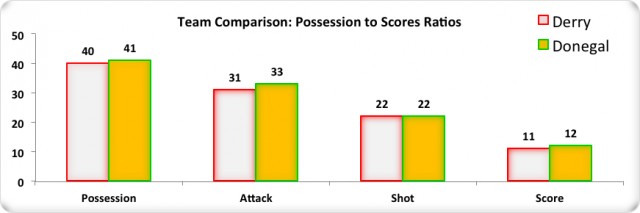
It is clear from figure 7, above, that both teams exhibited similar levels of success at each stage of possession. Donegal were marginally superior at progressing possession to attacks (Donegal 80.5%, Derry 77.5%). Derry created shots more effectively from their attacks, shooting from 71% of their attacks, compared to Donegal’s 67%. The advantage that Donegal held on the final scoreboard may lie in one of the last stats we look at; shot success rate. Donegal had a marginal advantage, with a success rate of 54.5%, compared to Derry’s 50%. Despite taking the same number of shots over the course of the game, Donegal scored from one more than Derry.
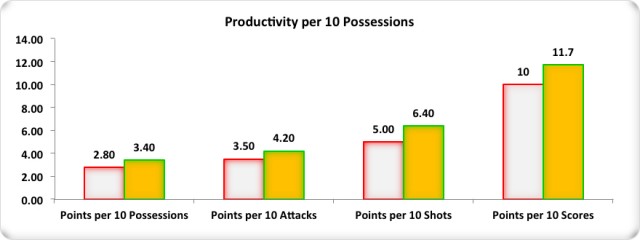
This solitary score happened to be the only goal of the game. Despite all the stats and breakdowns, the only aspect where there was a tangible advantage was in shot success, with Donegal finishing a goal chance, where Derry failed. This goal led to a higher output value for Donegal per 10 possessions (Figure 8). The old adage of ‘goals win games’ was entirely apt for this match. Many sceptics of stats will point to the scoreboard and argue that it is the only stat that matters. Based upon this game, that may be true. However, it is still vital for both teams to know where they can improve ahead of their next day out, or where they can exploit opposition weaknesses.
Figure 8: Productivity
Summary
There was little to separate these teams from a statistical point of view. Overall, Derry enjoyed the majority share of possession but were unable to capitalise. Donegal were slightly more clinical, with a marginally higher shot success rate, which compensated for their lesser possession share.
Derry
It is fair to argue that based upon the stats, Derry were unlucky to be on the losing side of this game. Both teams were very evenly matched, with Derry holding the advantage in terms of possession share (56%). Where Derry may look to improve will be in the pace of their attacks. Derry’s average possession was 45 seconds, compared to Donegal’s 34 seconds. This may be an endorsement of Donegal’s containment, but also something that Derry will be keen to counteract should they encounter this approach again.
While their kick outs overall were successful, winning 61%, they will rightly be concerned at having lost so much break ball from their own kick outs early in the second half. It was this period of the game when Donegal overhauled the Derry advantage and Derry were unable to secure possession from a series of their own kick outs. Addressing kick out strategy in order to arrest opposition momentum may be required going forward.
Donegal
Donegal will be happy with their victory, but will also be keen to address any issues that arose ahead of the semi final clash with either Antrim or Fermanagh. The obvious issue for Donegal was that they only secured 44% of total possession. When they did dominate possession they were able to have a direct impact on the scoreboard and this is certainly something they will seek to address going forward. Apart from targeting opposition kick outs, as they did very effectively in the second half, Donegal will also be keen to increase the number of turnovers they force from the opposition, having only forced turnovers on 17 occasions.