

Derry v Down Statistical Analysis
Throughout the 2015 Ulster Senior Championship, Ulster GAA will be compiling a report of the key statistics from each match. The reports will look at a range of factors contributing to game play, including possession breakdown, kick out success, possession to scores ratios and turnover stats.
The purpose of this project is to identify the key differences between team performance, and possibly help pin point where the key differences existed. Ultimately, it is hoped to identify the key area each team needs to address ahead of their next championship outing in 2015.
Kick Out Statistics
There were a total of 42 kick outs taken in this match, with Derry winning possession from 24 (57%), and Down 18 (43%). Both teams performed competently on their own kick outs, with Derry claiming 17/23 (74%), and Down securing possession from 12/19 (63%).
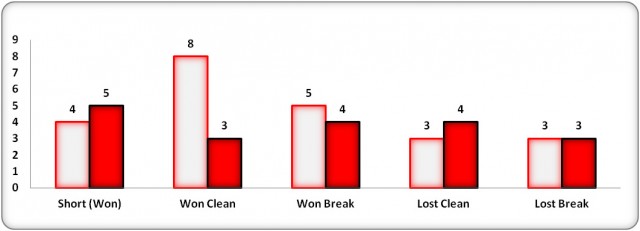
The kick out data throughout the USFC 2015 has varied significantly. This game encapsulated this variance perfectly. Neither team were afraid to utilise the short option when it presented itself, but both also appeared to have clear strategies for playing longer kicks to more congested areas of the pitch. Derry were the more successful with their longer kick outs, claiming 68% of the kicks they played long, while Down only broke even (50%) with kick outs they had to play long. Of particular concern for Down is the fact that they lost 4 of their own kick outs clean.
Figure 1: Kick Outs Won
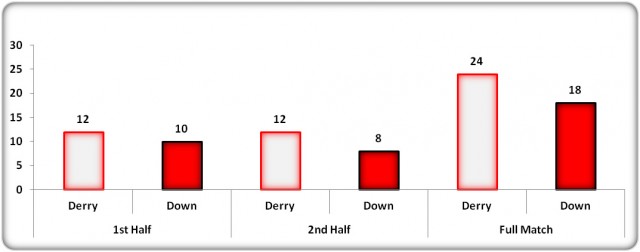
Figure 2: Kick Out Breakdown
Turnovers
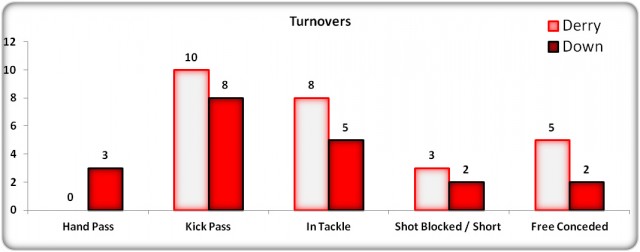
Derry lost possession 26 times, with their main issue seemingly their kick passing (10). However, they also lost an extremely high volume of possession in the tackle (8) and by conceding free kicks when in possession (5). Some consolation for Down must lie in the fact that they only had 20 turnovers – only Donegal have bettered this total so far, having recorded 19 turnovers against Tyrone. In an inter-county match a target of 20 or less is likely to be considered a good performance; Down are not likely to be overly concerned with their ability to retain possession on the basis of this performance.
Figure 3: Turnovers
Possession to Scores Ratios
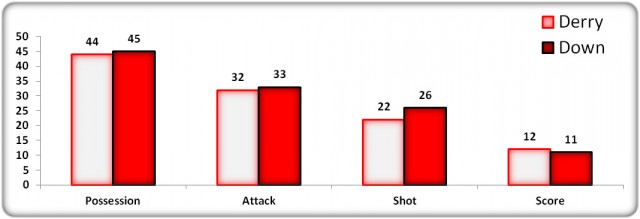
Despite losing the kick out battle, Down’s greater care with possession enabled them to shade the possession battle, albeit by the minimum margin. They were able to maintain this advantage as both teams converted 73% of their possessions to the attacking zone. Down were the more effective at creating shooting chances, with 58% of their possessions resulting in shots, while only 50% of Derry’s possessions ended in shots. However, the evidence is clear that Derry’s superior shot efficiency enabled them to win out, with 27% of their possessions converted to scores, while Down only managed to convert 24%. More specifically, Derry scored with 55% of their attempts, while in contrast Down only succeeded with 42% of their attempts.
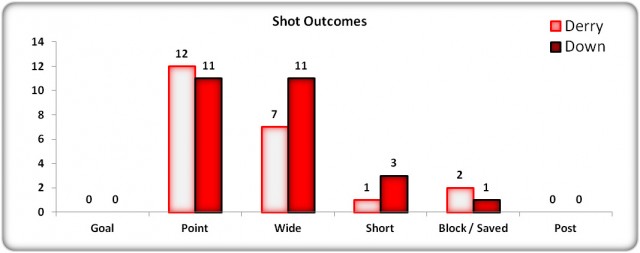
Derry’s superior shot success rate is evident from the shot outcome breakdown, which highlights only 10 unsuccessful shots, while Down registered 15 unsuccessful efforts. Of particular concern to Down will be their wide count of 11.
Figure 4A & 4B: Possession to Scores Ratios & Shot Outcomes
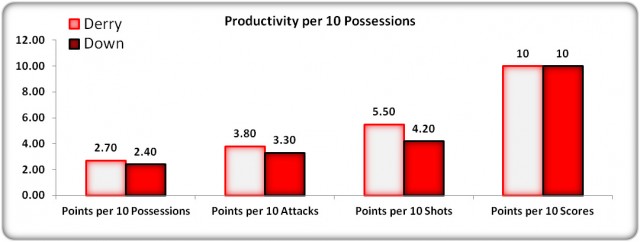
Down’s weaker finishing was reflected in their productivity rating of 2.4 points per 10 possessions, while Derry reached 2.7 points per possession. Based upon these productivity rates, Down would have required 5-6 more possessions during the match in order to sway the scoring in their favour. Neither team can settle for their productivity rating ahead of their next match, with a rate of 3.5 – 4.0 required as the championship progresses towards August and September.
Figure 5: Productivity
Summary
The reason for Derry’s superiority was their superior efficiency in front of goal. Derry shaded the kick out battle, while Down were more careful in possession with fewer turnovers, so overall possession share was finely balanced. This balance prevailed through until the final shots were taken, where Derry then edged the encounter. A shot success rate of 55% for Derry was far superior to Down’s 42%, and proved the difference between the teams on the final scoreboard.
Derry
The key positive for Derry is the final outcome, and their position in the Ulster semi final in a few weeks time. Within the performance they will be satisfied with their dominance of the kick out battle, in particular their ability to contest Down kick outs that were taken long. Their shot success rate of 55% was sufficient to win this match, but still allows some room to improve ahead of the semi final clash.
Their main area for concern will be their ability to create shooting opportunities from their possession. In the first half they created 15 shots from 23 possessions (65%). This was an average return; however, their second half performance only delivered 7 shots, from 21 possessions (33%). Having played the second half with a numerical advantage this ratio has to be a priority ahead of their semi final clash with either Armagh or Donegal.
Down
Despite the result Down have plenty of positives to build on ahead of their venture into the All Ireland qualifiers. Having only conceded 20 turnovers they were very careful with their possession. Despite getting edged in the midfield battle they made up for this through forcing Derry into turnovers 26 times. They were also more effective at creating shooting chances, converting 58% of possession to shots, while Derry only managed 50%.
However, from a Down perspective it is important to establish why their shooting return was so poor, scoring only 11 from 26 efforts (42%). Another alarming statistic is that Down appeared to rely heavily on free taking, with 7 of their 11 scores coming from set plays. It must be established if their poor shot conversion rate was due to poor shot selection or poor shot execution.