Analysis of Ulster Championship Kickouts
This report provides a summary of all the kick outs in the games up to the semi-final stage of the Ulster Senior football championship 2014. It will provide a comprehensive break down of the following areas:
• A general overview of all kickouts to date;
• The most accurate team from kickouts;
• The most productive team after winning possession from kickouts;
• Time taken per kickout and outcome.
This report hopes to conclude with information which answers the assumed suggestion that ‘the team who wins the midfield battle will win the game’.
General Overview
There have been 6 games to date in the Ulster Senior football championship including; 1 preliminary round game plus a replay and 4 quarter final games. From these 6 games there has been a total of 252 kickouts, with an average 42 kickouts per game. The Fermanagh v Antrim game had the most; 47, while the least came in the Derry v Donegal game; 26. The Down v Tyrone replay was the only game not to have had more kickouts in the second half compared to the first half. Although the differences are only marginal it suggests that the second half of games were ‘more open’, producing more shots.
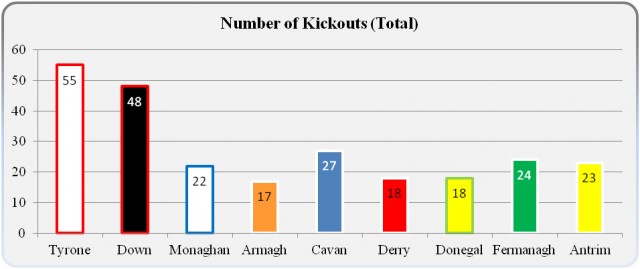
The graph above simply looks at the total number of kickouts each team has taken to date.
Accuracy from Kickouts
Who are the most accurate team?
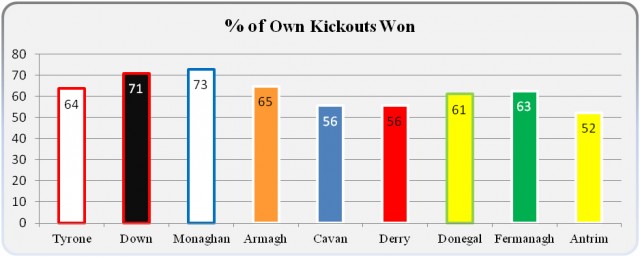
Figure 2 demonstrates percentage of possessions each team has won coming from their own kickouts. Firstly, Tyrone’s figure is correlated over 3 games with Down’s total over 2 games. To date, Monaghan lead the way, having claimed 73% of their own kickouts, closely followed by Down with 71%. Both Armagh and Donegal claimed more than their opponents, Cavan and Derry respectively as they went on to victory. Interestingly Fermanagh dominated possession from their kickouts compared to Antrim but failed to win the game.
It is worth noting in terms of individual games; Tyrone claimed 73% of their own kickouts in the replay against Down as they progressed therefore equalling Monaghan. However Tyrone only managed 53% in the drawn game with Down therefore putting individual games into perspective.
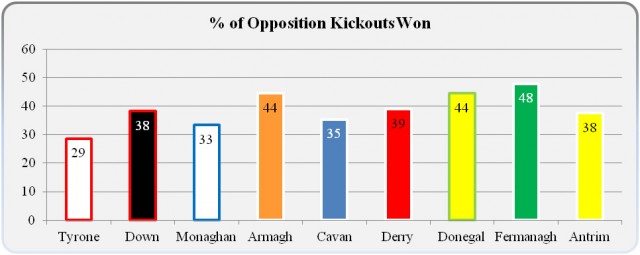
Following on from figure 2, the above graph (Figure 3) illustrates the percentage of opposition kickouts won. Monaghan (33%) have the lowest percentage from the teams having played one game. However, they managed to defeat Tyrone. Although only slightly greater compared to Cavan (35%) and Derry (39%) who were both defeated. It should be considered that Monaghan had a greater percentage of own kickouts won. Again Fermanagh (48%) dominated Antrim (38%) in winning opposition kickouts but were defeated. Tyrone came out worst as they only claimed 29% of opposition kickouts across the 3 games they played. This figure highlights a weakness for Tyrone, with their inability to win majority of possession at midfield compared to the other teams in Ulster, therefore enhancing the support for Niall Morgan’s short kickout approach to retain possession.
Productivity from kickouts won
The following section will investigate which team is the most productive from possession won via kickout. More specifically an insight into which team translates the most scores from kickouts won. It is important to note that this relates to total number of scores and not the division of goals and points.
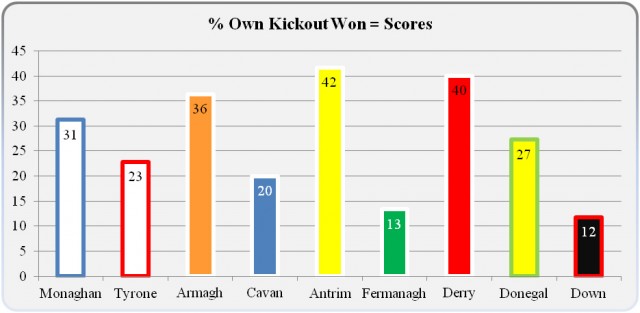
It is evident from Figure 4, that Antrim with 42% (5/12) and Derry with 40% (4/10) are the most effective teams in Ulster, to date, in translating possession won from their own kickouts into scores. Although Armagh are the third most effective; one of their scores was a goal. There were only two goals scored, coming from possession won via their own kickout, Tyrone getting the other in the replay against Down. Down with 12% (4/34), closely followed by Fermanagh with 13% (2/15) are the least effective in generating scores originating from their own kickouts. Interestingly, Down and Tyrone failed to register a single score via possession won from their own kickouts in the drawn game. Tyrone improved in the next two games delivering a translation rate of 27% (3/11) in the replay and 36% (5/14) against Monaghan. Down also improved in the replay, with a return of 21% (4/19).
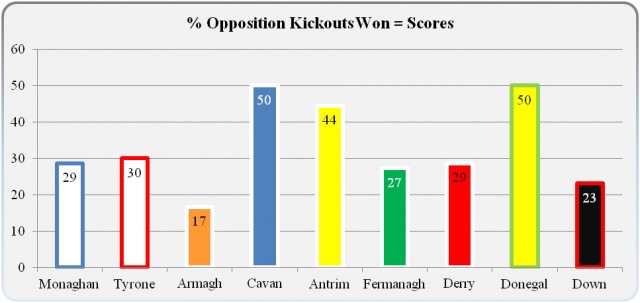
In terms of winning opposition kickouts and translating that possession into scores both Cavan (3/6) and Donegal (4/8) have been the most effective teams to date with a 50% return. Armagh, having won 12 opposition kickouts only generated 2 scores. Tyrone’s translation to scores per game improved throughout, climaxing with a return of 50% (3/6) against Monaghan but their average across the three games played was 30%. There were four goals scored originating from opposition kickouts won; Monaghan, Donegal, Antrim and Fermanagh grabbing a three pointer each. Interestingly, the goals scored by Monaghan and Donegal came in the second half as they progressed to the Ulster semi-finals.
Time Taken per Kickout
Time per kickout is measured from the second the ball goes dead until the goalkeeper makes contact with the ball on the restart, and calculated in terms of an average; displayed in seconds. It is then categorised based upon outcome; won resulting in the kicking team retaining possession and lost is the opposition gaining possession.
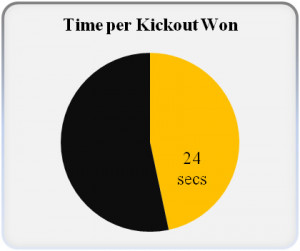
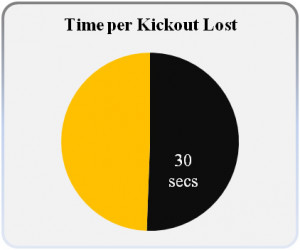
It can be observed from the graphs that the less time spent in taking a kickout the greater chance the kicking team has of retaining possession. In the opening 6 games of the Ulster championship, a kickout won took on average 24 seconds whereas a kickout lost took 30 seconds on average. This creates the argument that slowing the play down helps the opposition retain possession which is a particular tactic many teams use when a lead is obtained in a game. However the evidence suggests the goalkeeper should look to take the kick out quicker before the opposition have reorganised following an attack.
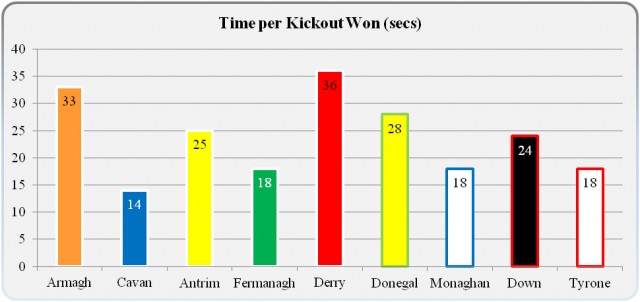
Figure 8 illustrates each individual team on the average time spent per kickout won. Cavan are the quickest team with Conor Gilsensan spending on average 14 seconds per kickout won. Derry spent 36 seconds and Armagh took 33 seconds; on average are the slowest in Ulster to date. However the previous information on kickouts won needs to be considered as Cavan and Derry both had 56% retention of possession from their own kickouts. Therefore combining percentage of kickouts won and time spent provides a more accurate understanding into the effectiveness of the kickout strategy each team deploys.
The quickest kickout to date has been 5 seconds, taken by Niall Morgan of Tyrone, on two occasions in the replay against Down. As relating to the above evidence both kickouts were won by Tyrone. To note, there were no kickouts taken in the Derry Donegal game which took less than 10 seconds. Thus providing evidence to suggest that this suited Donegal, allowing them to get reorganised following an attack.
Summary
The first conclusion to be made relates to the time taken per kickout. As the evidence to date suggests, teams should look to spend less time in taking a kickout as there is a greater possibility of retained possession. Tyrone and Monaghan have had the highest return of possession won from their own kickouts in a single game. This gives reason to the short kickout tactic both teams like to deploy.
Regards to the assumption that the team who win the midfield sector win the game, there is no glaring evidence to back this up, as only three of the winning teams from the five ties, dominated own and opposition kickouts won. In terms of productivity, it is more visible, as four of the winning teams had a higher percentage of scores coming from own kickouts won. Ultimately this suggests that is it vital to translate possession won via own kickouts, into scores, providing a greater possibility of winning the game. However, it is crucial for teams to become reorganised once a kickout is lost as more goals have been scored, originating from an opposition kickout compared to winning their own kickout.
—
Report compiled by Brian McClelland, Sports Science Intern, Ulster GAA – brian.mcclelland.ulster@gaa.ie


