Statistical Analysis of Fermanagh v Antrim

Throughout the 2014 Ulster Senior Championship, Ulster GAA will be compiling a report of the key statistics from each match. The reports will look at a range of factors contributing to game play, including possession breakdown, kick out success, possession to scores ratios and turnover stats.
The purpose of this project is to identify the key differences between team performance, and possibly help pin point where the key differences existed. Ultimately, it is hoped to identify the key area each team needs to address ahead of their next championship outing in 2014.
Ball in Play
The second quarter final of the 2014 Ulster Championship was, thus far, the highest scoring game, with 36 scores in total registered, including 5 major scores.
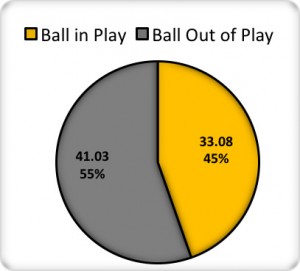
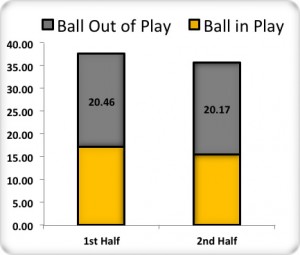
Despite the higher frequency of scoring, there was no significant change to the ratio of playing time to non playing time, with the ball in play for 45% of the total game time (Figure 1A). There has previously been a pattern where playing time is reduced when there are more scores in a defined period and this game reinforced that thought, with playing time in the second half less than 16 minutes while there were a total of 19 scores recorded (Figure 1B).
Figure 1A & 1B: Active Game Time
Possession
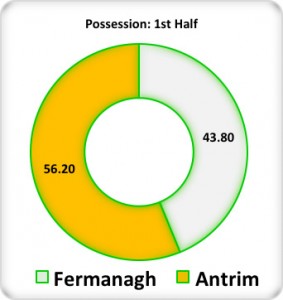
The first half possession battle delivered exactly what would be expected based upon the half time score board. Antrim enjoyed the majority of possession in the first half, securing 56% compared to just 44% for Fermanagh. This superiority was evident on the score board, with Antrim leading by 5 points, having converted 5 more scoring chances (Figure 2A).
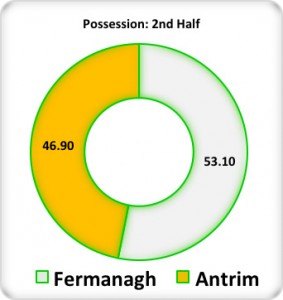
The second half was a notable improvement for Fermanagh, who managed to increase their possession share to 53%, compared to Antrim’s 47%. Fermanagh were also able to make this advantage pay over the course of the second half, outscoring Antrim by 1 goal. Unfortunately for Fermanagh they were unable to close the 5 point deficit (Figure 2B)
Figure 2A & 2B: 1st & 2nd Half Possession
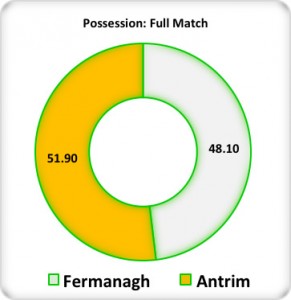
Over the full match it is fair to argue that this game followed the stereotypical notion that possession dominance is vital to win games. Many games have proved otherwise, including previous games in this year’s Ulster Championship. However, Antrim were able to convert a marginal possession advantage to a 2 point victory in this game, having secured 51.9% of possession compared to Fermanagh’s 48.1% (Figure 3).
Figure 3: Full Match Possession
Kick Out Statistics
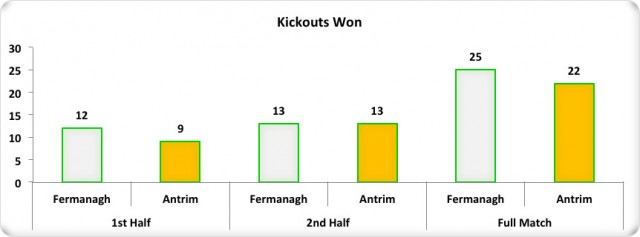
Despite their marginal possession superiority, Antrim secured less primary possession direct from kick outs, with Fermanagh claiming 25, while Antrim only managed 22 (Figure 4).
Figure 4: Kick Outs Won
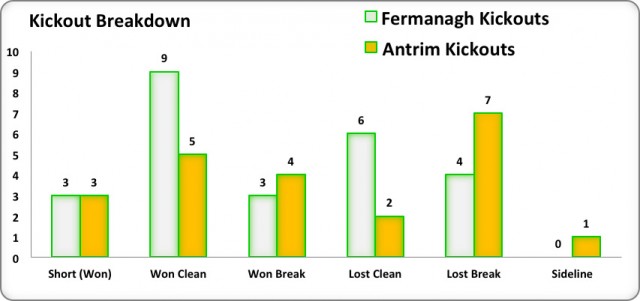
When analysing the breakdown of kick outs won, Antrim will notice a number of areas for concern, from kick outs at each end (Figure 5). They conceded 9 clean possessions to Fermanagh from Fermanagh kick outs, but more worryingly, they lost 7 kick outs through break ball from their own kicks. On the positive side from and Antrim view point, they did manage to secured a total of 10 possessions from Fermanagh kick outs, 6 of which were through break ball. Obviously Fermanagh will identify this as an area for improvement before embarking on their qualifier campaign.
Figure 5: Kick Out Breakdown
Turnovers
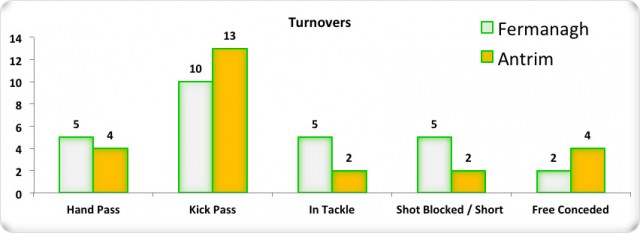
Apart from kick outs, the other key area for gaining possession is through turnover ball, so team will all be attempting to reduce the number of turnovers for which they are responsible. Antrim enjoyed a small edge in this department, only losing possession on 25 occasions, while Fermanagh lost possession 27 times (Figure 6). Neither team will be overly satisfied with the fairly high counts, but on the other hand they will be happy to have forced their opponent into a fairly high volume of turnovers. Based on the breakdown of turnovers, Antrim may identify their kick pass turnovers as an issue, while Fermanagh will look to 5 possessions lost through shots that were either blocked or fell short. Not only does this signify a loss in possession, but it also highlights a wasted opportunity to score.
Figure 6: Turnovers
Possession to Scores Ratios
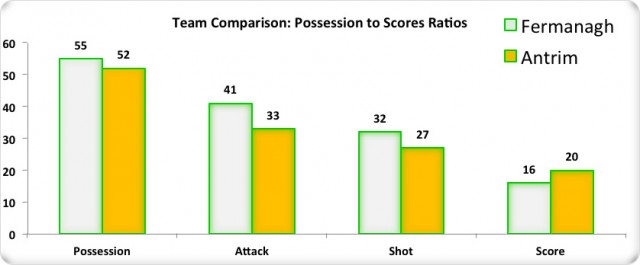
Both teams performed well in terms of conversion of possession to scores, with Fermanagh returning 29% of possessions to score, and Antrim delivering a provincial high this year of 38% of possessions converted (Figure 7). Upon further analysis, Antrim may still identify their ability to get the ball into the scoring zone as an issue. They only managed to progress 63% of all possessions into the scoring zone. However, when they did progress into the scoring zone they created shooting chances 82% of the time, and converted 74% of all shots taken. As well as signifying efficiency in the Antrim attack, it also indicates that defensively Fermanagh attempted to force the play high up the pitch, making it difficult for Antrim to progress the ball past the midfield area. While this worked in terms of Antrim only progressing 63% of possessions, it also left Fermanagh’s inside lines exposed, meaning Antrim were able to capitalise more often than not when they did create attacks.
Offensively, Fermanagh will be satisfied that they created shooting chances from 58% of their possessions, well over 1 in every 2 possessions led to a scoring attempt. However, they were only able to convert 50% of these scoring chances. Fermanagh will want to know why their shooting was unsuccessful, and when broken down they had goal attempts saved. Given the final score, this is crucial factor.
Figure 7: Possession to Scores Ratios
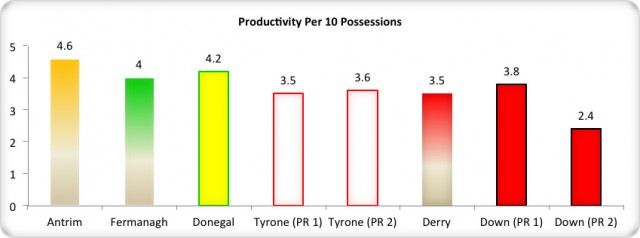
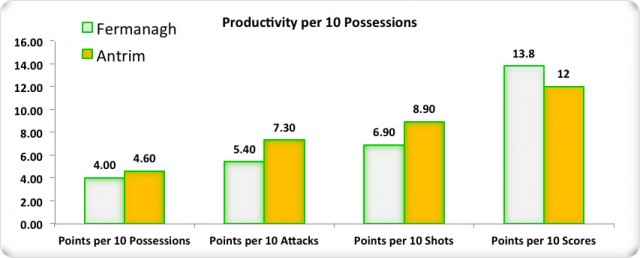
Both teams returned some of the highest productivity ratings so far in the 2014 USFC, with Fermanagh recording 4 points for every 10 possessions and Antrim registering 4.6 points per 10 possessions. These results are testament to the media perception that this was an open game of football, with a largely attack minded ethos employed by both teams. However, it will be interesting to see if Antrim can replicate this level of productivity when they meet Donegal in the sem-final.
Figure 8: Productivity
Summary
Despite leading well for large parts of this match the final result was no doubt closer than Antrim may have felt they deserved. However, based upon the statistics, the final result is probably a reasonably fair reflection of the match. Possession was fairly evenly matched, and both teams were superior at various stages of their possessions. Fermanagh were excellent up to the point of creating shooting chances, but their down fall was in the conversion rate, only converting 50% of their shots, with 4 goals chances saved. On the other hand, Antrim were clinical with their scoring chances, converting 74% of their shots, however, they did struggle to create attacks, only progressing 63% of possessions into the scoring zone. Ultimately, had any of the 4 goal chances Fermanagh had saved been converted, the result would have gone the other way.
Fermanagh
Fermanagh will look at how close they came to winning this match that for long periods seemed well beyond them. Despite an inferior share of possession they were able to finish within a single score of Antrim. In terms of securing more possession they will look to 10 possessions they conceded from their own kick outs, 6 of which Antrim won clean. It was notable that on at least 3 occasions the referee ordered a kick out to be taken again when Fermanagh had attempted to take a quick kick. A bit more attention to making sure the ball is correctly positioned before attempting these kicks may lead to a little bit more success.
Another key aspect for Fermanagh will have been their finishing, having converted only 16 from 32 shots taken. They recorded 8 wides, 3 short attempts and 4 shots were saved. In terms of the wides and short efforts, further video analysis will help them identify if the issues were related to choice of shooting position or shot execution. They will also be keen to address the 4 shots that were saved, and try to improve this going forward.
Antrim
Antrim will be disappointed that this game ended so closely given that they dominated on the score board throughout the match. That said, they will be happy to have secured the victory and will look at where improvement can be made ahead of the Donegal clash. Antrim lost possession through turnover ball on 25 occasions. Consider that Donegal accounted for Derry in the first round, despite Derry only losing possession 17 times. Antrim will need to reduce the amount of possession their sacrifice, in particular the 13 balls they lost through lose kick passing.
Antrim will no doubt be met with a different challenge against Donegal. They had to deal with a Fermanagh defensive strategy that focused on pressure on the ball early and allowing the full back line players to go man for man. This approach caused Antrim problems with getting the ball into the scoring zone, but when they did get the ball in they were very efficient. However, Donegal’s typical defensive set up sacrifices possession to a certain extent out the pitch, and drops extra cover into the full back positions. Antrim are likely to have more success at getting the ball into the scoring zone next day out, and if they can maintain their efficiency when the ball does go in then they could well pose serious problems for Donegal.
USFC 2014 – Summarised
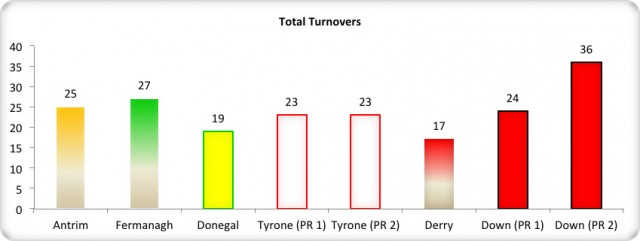
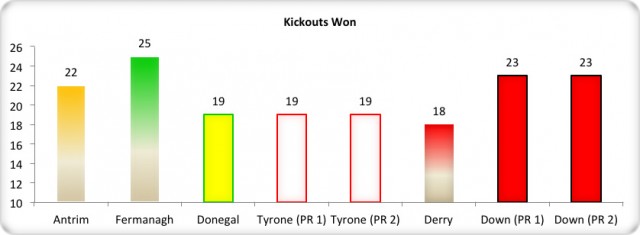
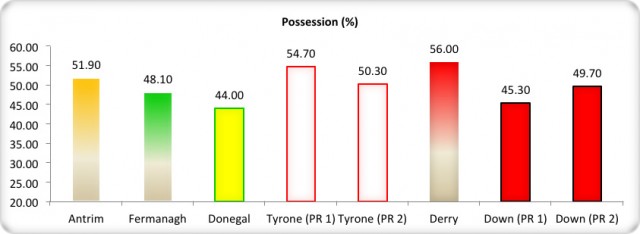
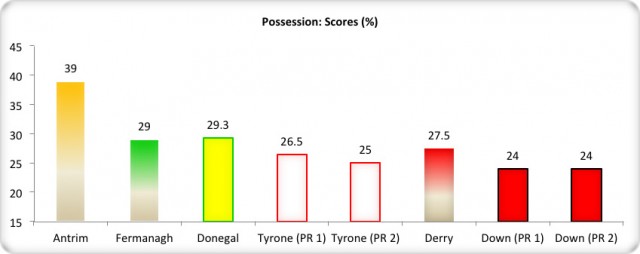
Below is a selection of key aspects of game play from the 2014 USFC. It allows for comparison between the teams that have played to date across this range of key aspects.
