

Throughout the 2013 Ulster Senior Championship, Ulster GAA will be compiling a report of the key statistics from each match. The reports will look at a range of factors contributing to game play, including possession breakdown, kick out success, possession to scores ratios and turnover stats.
The purpose of this project is to identify the key differences between team performance, and possibly help pin point where the key differences existed. Ultimately, it is hoped to identify the key area each team needs to address ahead of their next championship outing in 2013.
Ball in Play
In this, the fourth game of the Ulster Senior Football Championship 2013, we witnessed our highest active game time to date, with the ball in play for 38 minutes and 59 seconds, which equated to a total of 51% of the total game time (Figure 1). Despite the active game time, general reaction to this game would lead you to believe that it was the poorest game of the USFC to date, in terms of ‘quality’ football. Further investigation of the statistics from this match may help us to understand why this was the perception following the game, and also whether it was justified.
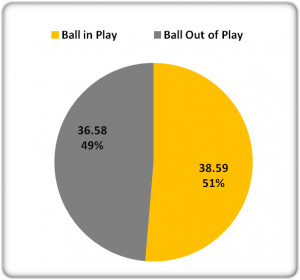
Figure 1: Active Game Time
Possession
Our statistics to date have established that possession is not necessarily the key to victory, with all 3 winning teams, Cavan, Donegal and Down enjoying victory without gaining the majority share of possession. However, this week’s match demonstrated the opposite, with Monaghan gaining the majority share of possession, 54.8% compared to Antrim’s 45.2% (Figure 2). The early indications of the possession share during the USFC 2013 would suggest that this breakdown has a minimal role in determining outcome; however, it is an excellent statistic to allow team management to measure their effectiveness in possession.
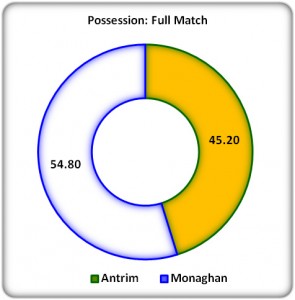
Figure 2: Full Match Possession
Last week’s game demonstrated that when broken into a half-by-half basis the team that had superior possession also delivered a positive impact on the scoreboard. A similar pattern was obvious this week, with Monaghan enjoying more possession in both halves, and also delivering greater scoring in both halves. In the first half, Monaghan had marginally better possession with 52.3%, and enjoyed a 1 point lead at half time, 0-04 v 0-05. (Figure 3). In the second half, Monaghan increased their share of possession to 57.3% compared to Antrim’s 42.7% (Figure 4). This possession superiority translated to a further 4 point improvement on their half time lead and an overall 5 point margin of victory, 0-06 v 0-11.
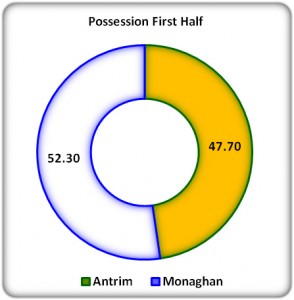
Figure 3: 1st Half Possession
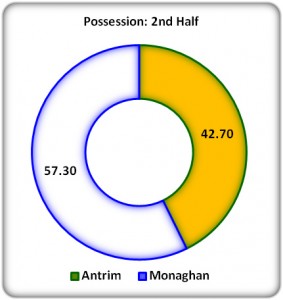
Figure 3: 2nd Half Possession
An interesting foot note to the overall possession statistics is that Monaghan are the first team this year, that were leading at half time, and subsequently went on to secure a greater share of possession in the second half. Most notable about this is the fact that they were also able to build on their half time lead.
Figure 5 depicts the USFC possession share for each team that has played so far this year, with Monaghan the first team to win having secured more possession than their opponents.
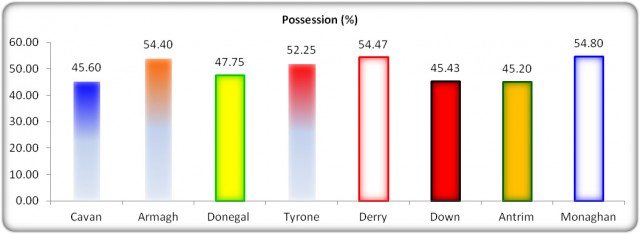
Figure 5: USFC 2013 Possession (%)
Kick Outs
There has been a surprising lack of correlation between the possession percentage and kick out success. Past notions tend to emphasise the importance of winning primary possession from kick outs. However, our championship analysis has not revealed any particular significance in terms of kick outs won.
Figure 6 is another example of the lack of correlation between kick out possession and overall possession share and in turn, outcome. Despite securing almost 10% more possession over the course of the game, Monaghan (20) won fewer kick outs than Antrim (21). What is particularly interesting is that Antrim won 50% more kick outs in the 2nd half; most likely as a result of having an extra man, but appeared unable to maintain this possession and subsequently unable to convert this primary possession to scores.
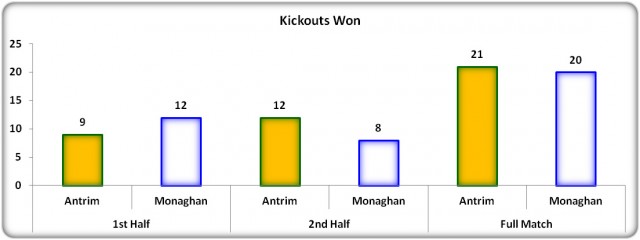
Figure 6: Kick Out Possession
The kick out breakdown paints a fairly obvious picture for Antrim, despite the fact that they were able to win more kick outs overall than Monaghan. When kick outs were played ‘long’ Antrim lost more than twice as many (13) of their own kick outs as they won (6). It appears that they were only able to improve the kick out stats when Monaghan were reduced to 14 men, therefore allowing the Antrim defenders more space to work a short kick out. Monaghan may also pay attention to the kick out breakdown when played long, as they also lost more of their own kick outs (7) than they won (5). Maybe this information raises the issue for these teams to work on ‘placed’ or short kick outs in order to secure possession from their own kicks.
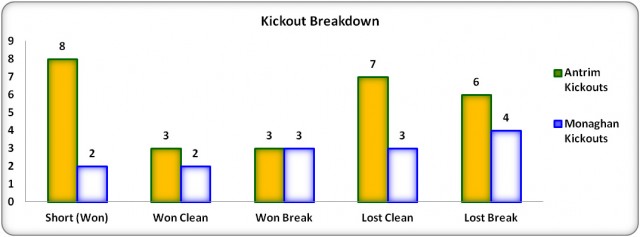
Figure 7: Kick Out Breakdown
Possession to Scores Ratios
Last week, Down provided an excellent demonstration of efficiency with their possession. Despite having less possession share in terms of time, they did have more possession in terms of distinct possessions than Derry and were able to convert a championship high, 35% of all possessions to scores. Derry were also able to convert 33% of possessions to scores, and it is fair to suggest that the excellent overall attacking stats led to the positive perception regarding the quality of the match.
As we can see from figure 8, both Antrim (49) and Monaghan (55) secured similar numbers of possessions to last week’s teams (Derry 48, Down 54), but their ability to convert to attacks was lower, and even more so their ability to generate scoring attempts and subsequent scores. The simplest and most glaring stat to compare is that last week’s game served up 35 scores, while this week’s game only provided 15 scores, despite each team having similar numbers in terms of possession gained.
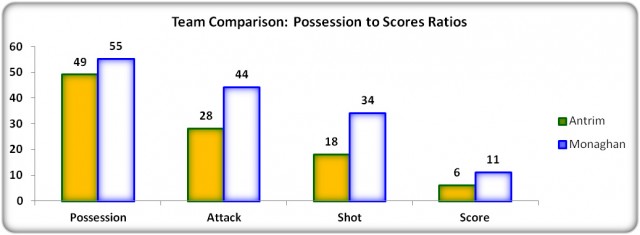
Figure 8: Possession to Scores Ratios
Figure 8 provides a clear view of where each team seemingly failed in their efforts to convert possessions to scores. Antrim could only convert 57% of all possessions to attacks, which compares very poorly with the previous lowest conversion rate from Donegal (67%). Overall, Antrim could only translate 12% of all possessions to scores. While Monaghan were more positive, generating attacks from 80% of all their possessions, and subsequently 77% of all attacks to shots, their obvious failing was in the success rate of their shooting attempts, which calculated at 20% of all possessions.
Both Antrim and Monaghan will have to be concerned with their possession to scores conversion rate, which equated to the worst on view so far in this year’s championship (Figure 9). Both teams had difficulties with different stages of their possessions, with Antrim clearly losing a significant portion of possessions through turnovers, while Monaghan had obvious issues with their shot success. Both teams will no doubt refer to further review of video footage to examine in more detail the issues evident.
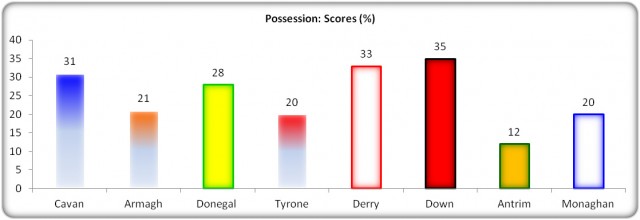
Figure 9: Possession: Scores (% Success)
Turnovers
Based on the previous graphical displays of possession conversion, it is clear that there was a significant level of turnovers in this game. Figure 10 confirms this, with both teams (Antrim – 36, Monaghan – 29) coughing up more turnovers than any other team in the championship this year.
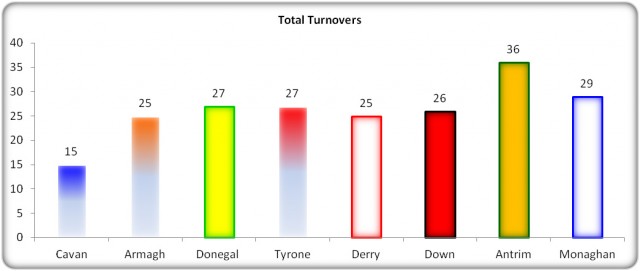
Figure 10: Turnover Statistics
Upon further analysis (Figure 11), both teams will discover more information regarding where their issues arose, and not surprisingly they support the previous observations made when interpreting the possession to scores ratios.
Antrim will note two distinct issues; their kick pass turnovers and the possession lost in the tackle. Both these issues clearly contributed to their inability to convert possessions to attacks.
While Monaghan have less obvious issues, they will be concerned about the 8 turnovers that came about through short or blocked shots. As most Gaelic football coaches and players will know, the one thing a player should avoid when shooting is dropping an effort short, and offering your opponent the immediate opportunity to counter attack.
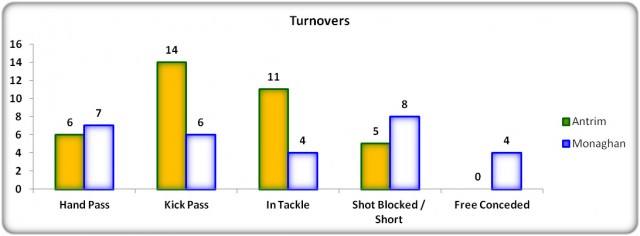
Figure 11: USFC 2013 Turnover Comparison
Summary
The statistics tell us part of the story regarding the general perception that this game was of poor quality. Both teams offered poor conversion of possession to scores, with Antrim losing a lot of possession through turnovers in the tackle and the kick pass, while Monaghan demonstrated a very poor success rate from shots taken. Both these factors are understandably considered to be frustrating factors for supporters, but also for the neutral. Some may argue that there may have been good defensive play on offer, but further investigation may uncover that a significant portion of the turnovers and poor finishing were unforced.
Antrim
Antrim will no doubt be very disappointed with the result, and will feel they did not do themselves justice in many areas of the pitch. The key information Antrim must pay attention to is that they were only able to advance 57% of their possession into attacking positions.
The turnover analysis has identified that their kick passing was a major issue that will need to be addressed. The management and coaching team will need to establish if the high volume of turned over kick passes was due to poor pass selection, poor skill execution, or both, and then address the issues in training.
They will also have to cut down the volume of possession lost in the tackle. This may require work to ensure players do not carry the ball into the tackle, but move the ball before contact. However, they may also have to improve their ability to hold onto the ball and break the tackle when they have no option but to take the ball into contact.
It is also important that they do not ignore their lower share of possession and poor return on their own kick outs. They could easily forget about this factor when looking at the overall kick out results, but until Monaghan had a man sent off, Antrim were struggling to win their own kick outs, losing a high number clean and through break ball.
Monaghan
Despite winning the game, Monaghan will be disappointed with their attacking performance. Having played some high scoring and fluid attacking football on their way to winning Division 3, they will feel they should have made much better use of the superior possession gained in this game. In particular they will have identified their finishing as an issue that needs urgent attention.
When they review their failed efforts at scores they will have to go through a similar process to Antrim, in identifying whether shot selection was poor, or was there poor skill execution, or did both contribute. It is likely both were factors and this will need to be addressed ahead of their semi final meeting with Fermanagh or Cavan on Saturday 29th June.
By Claire Curran Wed 12th Jun


