
Throughout the 2013 Ulster Senior Championship, Ulster GAA will be compiling a report of the key statistics from each match. The reports will look at a range of factors contributing to game play, including possession breakdown, kick out success, possession to scores ratios and turnover stats.
The purpose of this project is to identify the key differences between team performance, and possibly help pin point where the key differences existed. Ultimately, it is hoped to identify the key area each team needs to address ahead of their next championship outing in 2013.
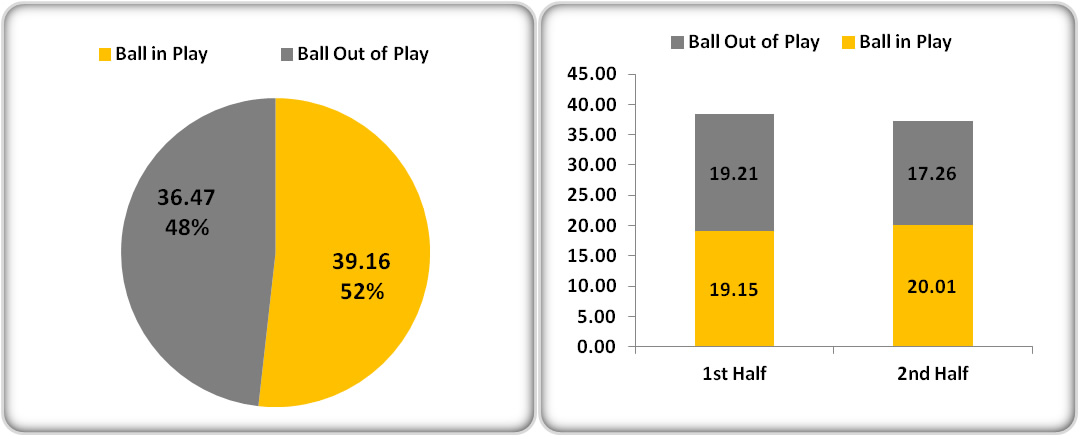
Ball in Play
In our first USFC Semi Final of 2013, we were treated to our highest active game time of the championship thus far. The ball was in play for 39 minutes and 16 seconds (52%) of the total game time. As has been the case throughout the championship, active time is roughly half of the total game time. Despite playing what is supposed to be a 70 minute match, no game so far has witnessed over 40 minutes of football. An addition to this week’s analysis is having a look at how each half measured up, with figure 1B showing marginally more active time in the second half.

Figure 1A & 1B: Active Game Time
Possession
The media and public reaction to this game appeared to focus on Down’s missed opportunities and the intense defensive approach that appeared to be adopted by both teams. What our possession statistics, and indeed, all our statistics will reveal is that this match was almost perfectly balanced across all the key areas, with one notable difference.
Figure 2 is the first example of the fine balance of this match, and our closest match to date in terms of possession share, with Down securing just 0.6% more possession than Donegal.
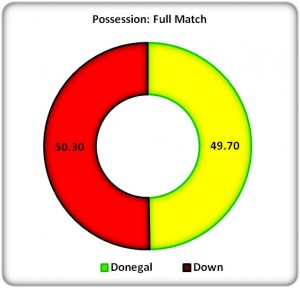
Figure 2: Full Match Possession
When breaking down possession share into a half by half basis we reveal more of the same, with Down enjoying approximately 5% more possession in the first half (Figure 3), and Donegal enjoying a similar pattern in the second half (Figure 4). The tight margins in possession share, both in each half and over the course of the whole match in reality only serve to confirm the close nature of the match throughout.
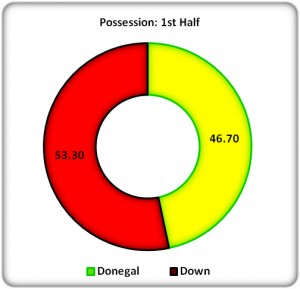
Figure 3: 1st Half Possession
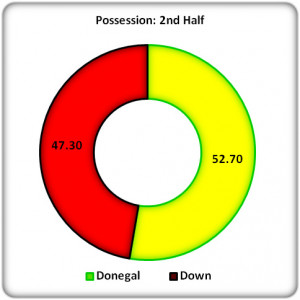
Figure 4: 2nd Half Possession
Our snapshot of the USFC 2013 so far demonstrates that both teams enjoyed more possession than in their quarter final, and, although marginal, Donegal once again delivered a win despite an inferior share of possession over the course of the match (Figure 5).
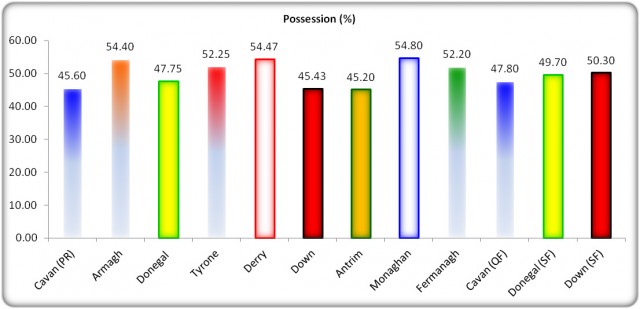
Figure 5: USFC 2013 Possession (%)
Kick Outs
This match had the fewest kick outs of the championship so far. Indirectly, the volume of kick outs points towards the defensive approach adopted by both teams, but also highlights the efficiency demonstrated by both in front of goal. If we calculate totals for both teams, there were 21 scores in this game, and only 27 kick outs, meaning there were only 6 kick outs that followed a wide ball.
When analysing this match, it is clear there was minimal difference between the teams, with Donegal winning 1 more kick out over the course of the game. Yet again, we are presented with another statistic that demonstrates the closeness of the match on Sunday.
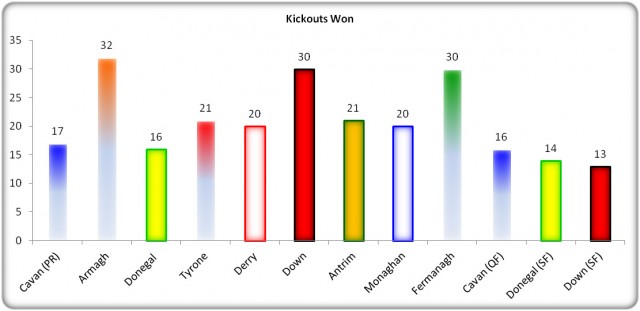
Figure 6: Kick Out Possession
Possession to Scores Ratios
Given how balanced the game was, in so many of the key areas, it was inevitable that there would be a singular key difference between the teams which enabled Donegal to emerge with victory at the final whistle.
Not surprisingly, both teams had an identical number of possessions (58), which provides us with an excellent platform to assess any differences in the team performances thereafter (Figure 7). Donegal converted one more possession to an attack (Donegal – 36, Down – 35), while Down were more successful at working the scoring opportunity (Down – 20, Donegal – 17).
At this stage, we come to the key difference between the teams, and it is not a spectacular revelation. Donegal were more efficient in their finishing, converting 12 of their 17 efforts to scores, a success rate of 71%, while Down could only convert 45% of their efforts (9 from 20). A point worth noting is that Donegal’s number of shots and their exceptional success rate were identical to the figures they delivered against Tyrone. So far in the USFC 2013 they have provided an excellent demonstration of efficiency in front of goal.
As we are aware at this stage, Down will be reflecting on Sunday’s match as an opportunity missed, and figure 8 will do nothing to ease the frustration, providing clear evidence that they did create enough opportunities to win this game, and simply failed to match Donegal’s accuracy.
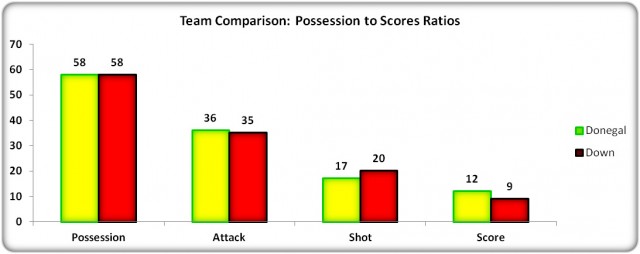
Figure 7: Possession to Scores Ratios
The defensive set up of both teams and intensity of the tackling witnessed is well documented at this stage, but figure 8 provides excellent support to the observations. Down’s defensive work rate was able to reduce Donegal’s possessions to scores success rate from 28% to 21%. However, Donegal were able to reduce Down’s previous championship high of 35% to 16% (the only lower rate so far being Antrim with 12%).
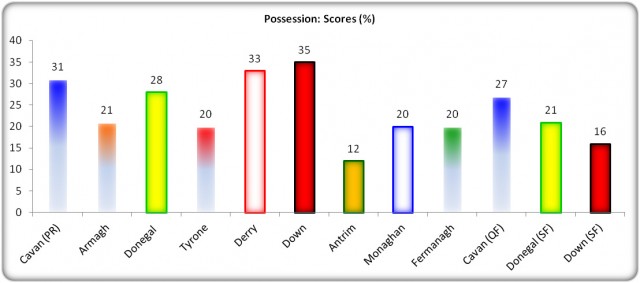
Figure 8: Possession: Scores (% Success)
Turnovers
Our kick out statistics and shooting success rates would suggest that wayward shooting was not an issue, which in turn would suggest that the possession conversion rates were reduced due to turnovers being forced.
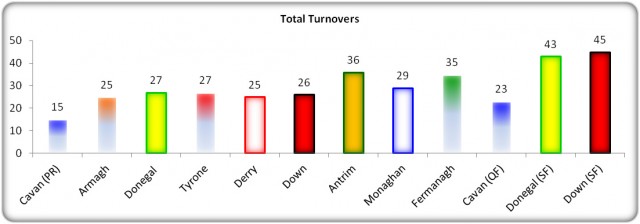
Figure 9: Turnover Comparison 2013
Figure 9 provides clear evidence of the intensity of both teams approach to the defensive side of the game. Prior to Sunday, Antrim had coughed up most possession through turnovers (36), however, Donegal lost possession 43 times and Down 45 times over the course of Sunday’s game. Many ‘purists’ will be critical of the quality of traditional skills on display, but there is a need to applaud the work rate, intensity and quality of the tackling that was able to force such high numbers of turnovers from the opposition.
Further analysis will rub further salt into the Down wounds (Figure 10). Having forced Donegal to lose possession no fewer than 17 times through their tackling and 14 times through stray or intercepted kick passes, Down had 10 attempts at scores blocked or fall short, including one shot that hit the post.
There is no doubt that Donegal will be working very hard to reduce the volume of turnovers ahead of the Ulster final, in particular ball lost in the tackle and via kick passing, both areas that Donegal would have been notoriously strong over the past couple of years.
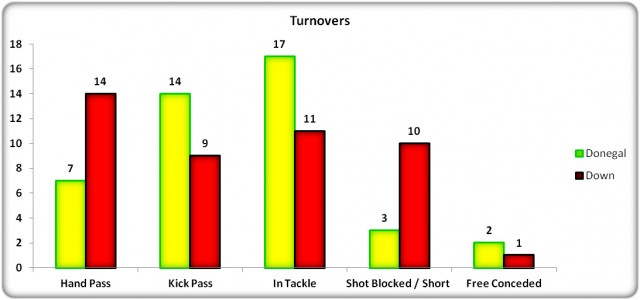
Figure 10: USFC 2013 Turnover Comparison
Summary
We were presented with a very different and interesting game this week in terms of tactics employed. Upon first watch it was clear that both teams were working ferociously when they did not have the ball, and as the game developed it became evident that the smallest incidents were going to make the difference come the final whistle.
The statistics reinforced this still further, with some areas almost perfectly balanced. Ultimately the difference between the teams was in Donegal’s superior accuracy from their shooting chances created, with Down having too many efforts fall short or being blocked down.
Down
This defeat will be extremely disappointing for Down, not just because of the result, but because of the fact that they had created the chances needed but were unable to execute at the crucial moments. The statistic that will hurt most is the 10 shots that fell short or were blocked down. If 3 of these efforts had travelled the distance Down would have at least secured a draw. They also lost 14 possessions through lose hand passes and it will be important to assess these incidents in an attempt to improve player decision making as they progress into the qualifiers.
Despite defeat, Down will have to be hugely satisfied with their defensive effort, having forced Donegal to lose a lot of possession over the course of the match, and indeed limit them to just 17 scoring efforts. Unfortunately, they were up against the most clinical team in Ulster, and possibly Ireland, at present and the 17 chances offered up were sufficient to secure enough scores for Donegal to enjoy victory.
Donegal
Once again, the winning team from this match will be happy with the result, but will be eager to address the issues that manifested themselves over the course of the match. The key statistics that Donegal will be keen to improve upon is their volume of turnovers, in particular lost in the tackle. Over the past couple of seasons Donegal have been clinical with possession and have limited the amount of possession they turnover, especially in the tackle and through kick passing, so there will be a big emphasis on reducing these numbers once again when they take the field for the Ulster final on the 21st July.
They will also be keen to continue their ruthless streak in front of goal, with a shot success rate of over 70% from their 2 games played so far. By ensuring they maintain this success rate they leave it very difficult for teams to limit their chances sufficiently to defeat them, as was evidenced on Sunday past.
By Claire Curran Wed 26th Jun


