

Statistical Analysis of Tyrone v Down

Throughout the 2014 Ulster Senior Championship, Ulster GAA will be compiling a report of the key statistics from each match. The reports will look at a range of factors contributing to game play, including possession breakdown, kick out success, possession to scores ratios and turnover stats.
The purpose of this project is to identify the key differences between team performance, and possibly help pin point where the key differences existed. Ultimately, it is hoped to identify the key area each team needs to address ahead of their next championship outing in 2014.
Ball in Play
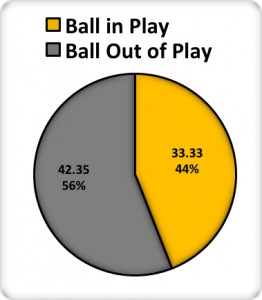
Following the start of the Ulster Senior Football Championship on Sunday past we have produced our first in depth statistical report of 2014. An issue that was highlighted throughout 2013 was the amount of inactive time over the course of a match. Sunday’s match had 56% of total time when the ball was out of play (Figure 1A). Barring injury stoppages, the longest inactive period was 1 minute 40 seconds when play was stopped for a Tyrone 45m kick, which was delayed due to interference from a Down player.
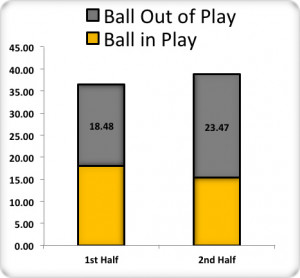
Interestingly, the media and public reaction to the game was largely in agreement, that the first half was poor, and the second half much better. However, as we can see in figure 1B, there was significantly more inactive time in the second half. It is fair to argue that the reason for the positive consensus towards the 2nd half lies in the scoring pattern, with 15 scores in the second half (12 from play), in comparison to 9 in the first half (3 from play). It is worth noting that the higher volume of scoring was obviously one of the contributing factors to the reduced active time in the second half.
Figure 1A & 1B: Active Game Time:
Possession
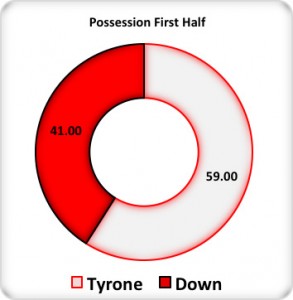
Unsurprisingly, Tyrone dominated possession in the first half (Figure 2A), which was reflected on the half time scoreboard, with Tyrone enjoying a 5 point lead. Possession in the second half was almost perfectly balanced, with Down marginally superior with 50.2% (Figure 2B). Despite breaking even in possession terms in the second half, Tyrone were unable to prevent a 5 point swing in favour of Down which lead to the drawn result.
Figure 2A & 2B: 1st & 2nd Half Possession:
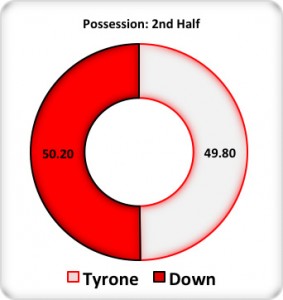
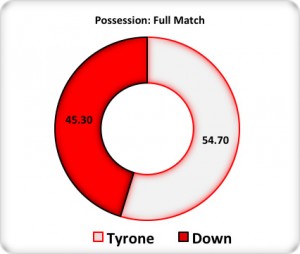
Over the course of the match Tyrone enjoyed the majority share of possession (Figure 3), but ultimately this advantage in possession did not translate to a successful outcome. During the second half Down dominated possession for approximately 10 minutes, scoring 2-3, with Tyrone securing no possession either from kick outs or through turnover ball.
Figure 3: Full Match Possession:
Kick Out Statistics
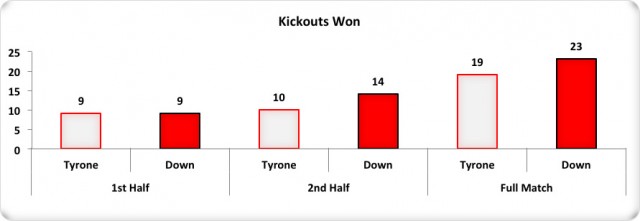
Despite a superior possession share, Tyrone only won 45% of the kick outs taken during the game, with Down securing possession from 55% of the kick outs (Figure 4).
Figure 4: Kick Outs Won:
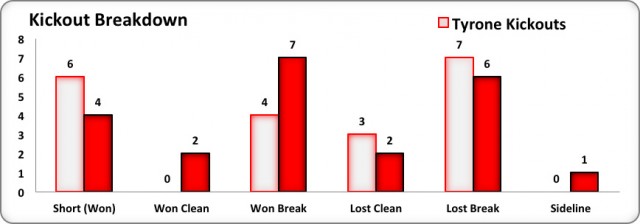
Both teams will inevitably scrutinise the kick out statistics in order to improve next day out, in particular their own kick outs. On the basis of figure 5 we can begin to understand where each team will need to improve ahead of the replay. Tyrone lost a total of 10 of their own kick outs, with Down losing 9 of their own kick outs. Tyrone broke even from their own kick outs, only claiming possession from 10, while Down fared better, securing possession from 13 of their own kicks.
Figure 5: Kick Out Breakdown:
There was a lot of speculation surrounding the effect the loss of Niall Morgan had on Tyrone. Before Niall Morgan received a black card he took only 8 kick outs, 5 of which Tyrone won. However, only one of these was a short kick out, the remainder were break ball won in the middle sector. So, while many attributed Tyrone’s loss of momentum to the change of goalkeeper it may be apt to judge the effectiveness of the players in the middle third rather than the impact of the person taking the kick outs.
Turnovers
Other than kick outs, the other main source of possession is turnover ball, with all teams keen to reduce the incidence with which they lose possession to their opponents.
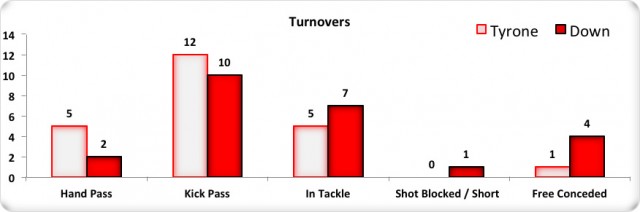
Neither team were particularly bad in terms of turnover volume, with Tyrone losing possession on 23 occasions, compared to 24 times that Down lost possession (Figure 6). If each team were to analyse their turnovers both may have slight concerns. Tyrone will be keen to reduce the number of hand passes that went astray (5), while Down will be disappointed to sacrifice possession on 4 occasions through concession of a free kick.
Figure 6: Turnovers:
Possession to Scores Ratios
Given that Tyrone enjoyed more possession, it is important to establish why this did not translate to a victory (Figure 3). To reinforce the possession percentage statistics, Tyrone secured 4 more possessions over the course of the match. Tyrone (77%) were more effective than Down (66%) at generating attacks from their possessions. However, Down were better able to manufacture shots (70%) from these attacks than Tyrone (55%). Both teams had a success rate of 52% from their shots taken.
Figure 7: Possession to Scores Ratios:
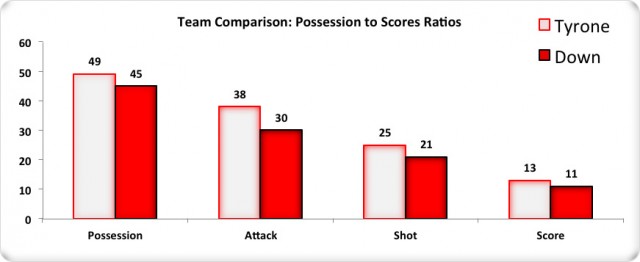
On the basis of figure 7, it is understandable that this game finished in a draw. Both teams excelled in different aspects of the game. Tyrone were comfortable with getting the ball into the scoring zone, but not as clinical with getting shots taken, while Down struggled to convert possession to attacks, but when they did they were more effective at generating shooting chances.
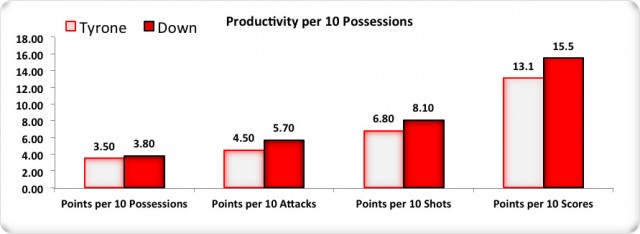
Tyrone converted 27% of possession to scores, while Down only converted 24% to scores. However, it is important that we do not undervalue how important goals can be in deciding the outcome of the game. Despite Down scoring 2 less scores (11) than Tyrone (13), they still managed to secure a draw on the basis that they scored 3 goals compared to Tyrone’s 2. Another way to quantify this is to measure team productivity. That is, points return for equivalent number of possessions.
Based on Sunday’s game Down were more productive with the possession, delivering 3.8 points per 10 possessions, compared to Tyrone’s 3.5 points per 10 possessions (Figure 8). On this basis, if both teams secured 50 possessions in a match, Down would be expected to score a total of 19 points, with Tyrone scoring 17-18 points.
Figure 8: Productivity:
Summary
Our first Ulster Championship outing of 2014 presented us with a statistical battle which was completely reflective of the final outcome. Each team were superior is different aspects, which evidently balanced out over the course of the match.
Tyrone were able to secure more possession, and subsequently build more attacks, where Down struggled to generate attacks from the lesser share of possession. However, Down were more incisive when they did get the ball into the scoring zone and managed to create shooting chances more effectively despite their limited possession. Ultimately the balance was maintained with both teams returning a 52% shot success rate.
Down
While many feel Down let this result slip, they will reflect on the statistics and be feeling fairly positive. They managed to secure another chance at this fixture despite enjoying almost 10% less possession. They also exerted dominance over the kick out battle and will take this as a positive sign that they can secure a greater overall share of possession in the replay. However, they will be keen to progress possessions into the scoring zone more regularly. They only managed to convert 66% of all possessions to attacks, which fared poorly when compared to Tyrone (77%). When Down did generate attacks they were the more productive, delivering a figure of 5.7 points per 10 attacks. If Down can improve possession share, improve their ability to progress to possession to attacks and maintain productivity on Saturday then they may well be able to secure a victory.
Tyrone
Tyrone will reflect on the fact that they enjoyed more possession over the course of the match, and were able to create attacks from 77% of all possessions. They will rightly be paying attention to their own kick outs, having only claimed possession from 50% of their own kicks. If they can increase this percentage then they should be able to increase their possession share. An increased possession share would likely leave Tyrone in a strong position to win the tie, but by increasing their productivity they could leave the outcome beyond doubt. Despite generating attacks more effectively, Tyrone only delivered an outcome of 4.5 points per 10 possessions. An improvement in their productivity will see Tyrone in a much stronger position to capitalise on advantages they have in possession stakes.