
Statistical Analysis of Antrim v Donegal
Throughout the 2014 Ulster Senior Championship, Ulster GAA will be compiling a report of the key statistics from each match. The reports will look at a range of factors contributing to game play, including possession breakdown, kick out success, possession to scores ratios and turnover stats.
The purpose of this project is to identify the key differences between team performance, and possibly help pin point where the key differences existed. Ultimately, it is hoped to identify the key area each team needs to address ahead of their next championship outing in 2014.
Time in Possession
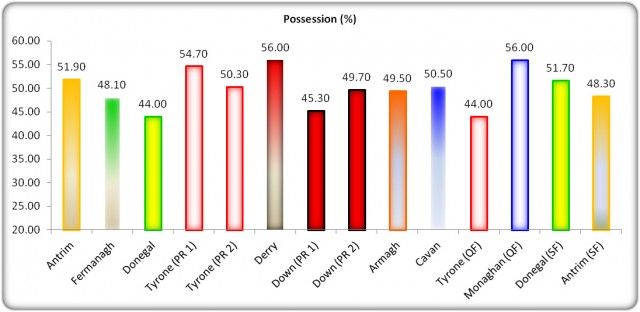
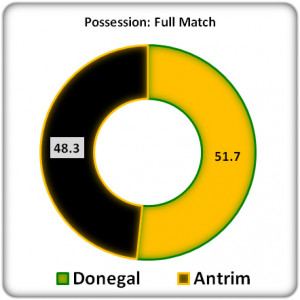
Despite enjoying more possession in the first half, by almost 10%, Donegal were unable to convert this superiority to the scoreboard, with the teams going in level at half time. Surprisingly, in the second half Antrim enjoyed more time in possession (51.4%), yet they lost this period heavily, on a score line of 3-9 to 0-5. Over the full game (Figure 2), Donegal spent marginally more time in possession (51.7%), and ultimately converted this to a 13 point victory, highlighting a much greater efficiency with possession than Antrim.
Figure 1A & 1B: 1st & 2nd Half Possession
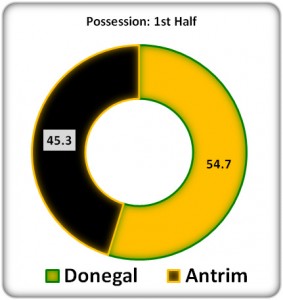
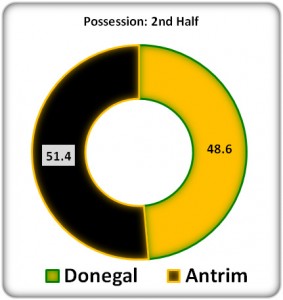
Figure 2: Full Match Possession
Possession to Scores Ratios
Donegal spent marginally more time in possession over the course of the match, but upon further analysis it is clear to see that Donegal had significantly more possessions over the course of the game; 57 to Antrim’s 41 (Figure 3). What this does tell us is that Donegal were more dynamic in possession, ultimately taking less time to move the ball into shooting positions, where Antrim utilised a more patient build up (Figure 4).
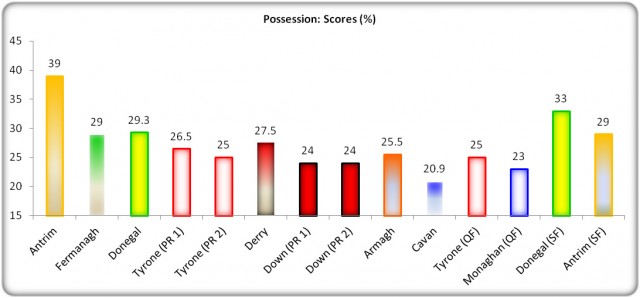
It is worth highlighting that, including this game and their previous matches, both Antrim and Donegal have delivered the highest return of scores per possession. The highest so far was Antrim’s performance versus Fermanagh (39%), while in this match they were reduced to 29%, which is still the fourth highest success rate of the season. Antrim’s 29% in this match is only bettered by Donegal versus Derry (29.3%) and the 33% success rate they delivered in this match.
There are certainly positives for Antrim in these conversion statistics, in that they are comparable with Donegal in most areas. Unfortunately from an Antrim point of view they were unable to secure a similar volume of possessions in order to compete on the scoreboard.
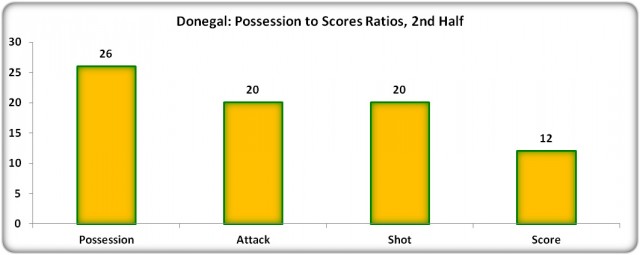
An interesting aside for this game is Donegal’s second half performance. From 26 possessions, they converted 20 to attacks (77%). Of these 20 attacks, every one resulted in a shot, with 12 scores taken, totalling 18 points (Figure 5). In the past number of seasons analysing statistics, it is fair to argue that this is possibly the most productive period of attacking football witnessed so far.
Figure 3: Possession : Scores Ratio
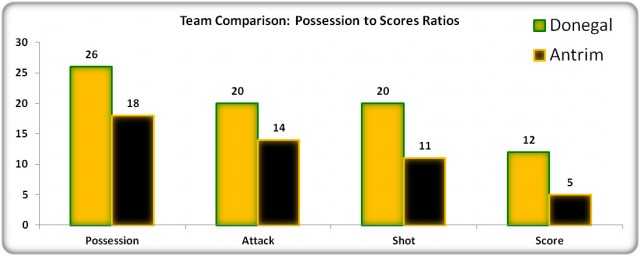
Figure 4: Time per Possession
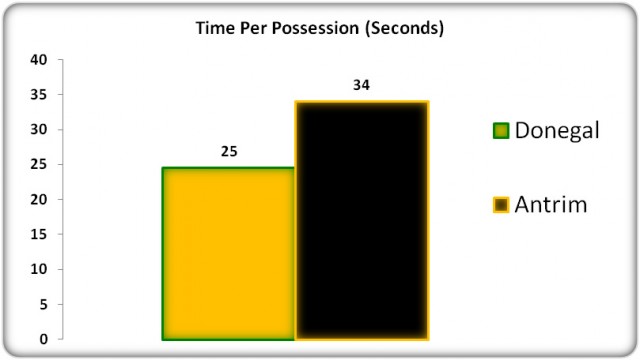
Figure 5: Donegal’s 2nd Half Possession to Scores Ratio
Kick Out Statistics
Donegal secured possession 16 times more than Antrim throughout this match (57 to 41). Given both teams had comparable rates of conversion it was ultimately this superiority which allowed Donegal to enjoy a comfortable victory. Outside of the throw ins at the start of each half, and any ‘hop balls’ over the course of the game, kick out possession and turnovers are the predominant means of gaining possession.
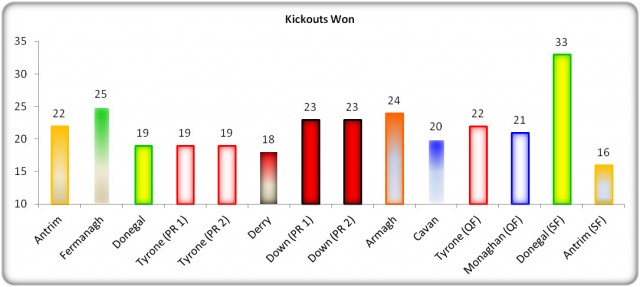
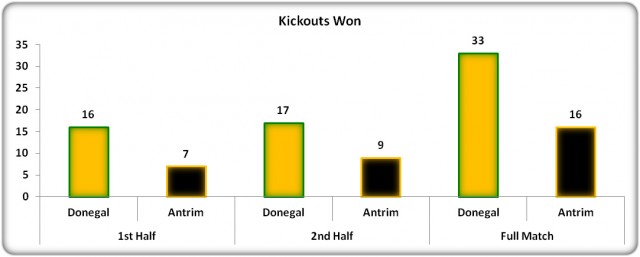
This was the first game of this year’s championship where the kick out battle appeared to directly impact upon the outcome. Donegal secured 33 possessions from kick outs (67%), in contrast to Antrim’s 16 possessions (33%).
Figure 6: Kick Outs Won
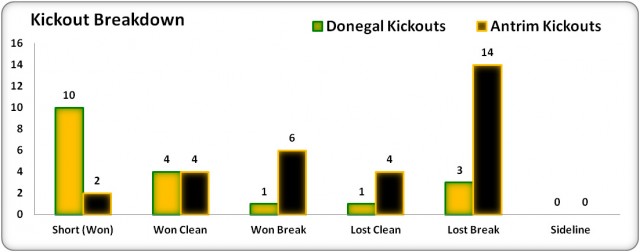
The kick out breakdown paints a clear picture of both kick out strategy and relative success and failings. Donegal obviously used a short kick strategy as often as possible, claiming 10 possessions (Figure 7). Antrim evidently were confident in their ability to win the midfield having only kicked 2 short. However, this confidence appears to have been misplaced, with Antrim only winning 14 from 37 (38%) kick outs which were played long. The major warning flag for Antrim must be the figure that they lost 14 possessions from break ball on their own kick outs, only winning 6.
Figure 7: Kick Out Breakdown
Turnovers
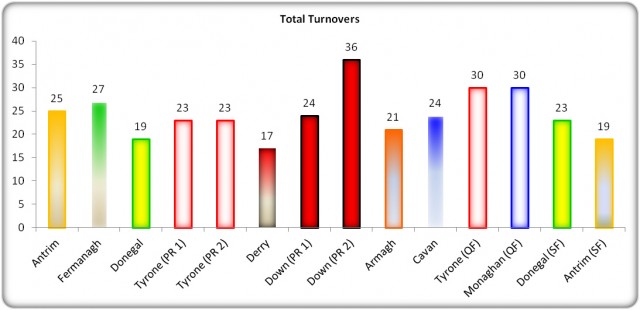
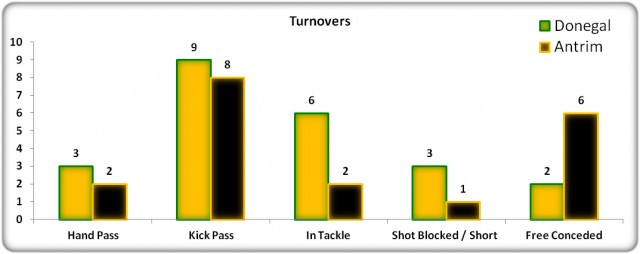
Providing further back up to the significance of the kick out battle in this match, the turnover count highlights another area where Antrim were competitive to the extent of being superior to Donegal (Figure 8). Donegal sacrificed 22 possessions, while Antrim only lost 19. It is important to remember that these numbers can also be affected by overall volume of possessions. A total of 39% of Donegal’s 57 possessions resulted in turnover ball, while 46% of Antrim’s 41 possessions resulted in turnovers. In terms of specific areas to address, neither team should have any major concerns, although Antrim may look to the 6 possessions lost through concession of a free kick. By the same token, Donegal may be slightly concerned at having lost 6 possessions in the tackle.
Figure 8: Turnovers
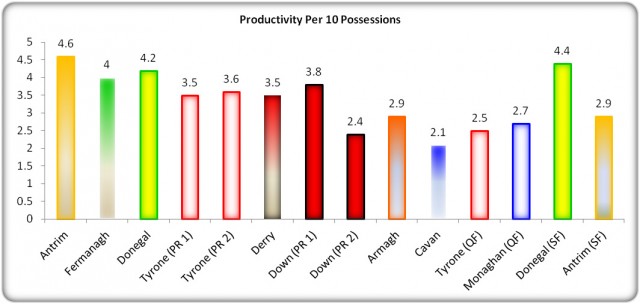
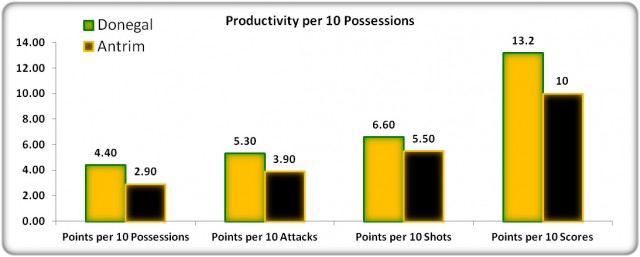
Aside from kick out supremacy, Donegal were also the more productive of the teams (Figure 9), with a return of 4.4 points per 10 possessions. Ironically, in this year’s championship this productivity is second only to Antrim versus Fermanagh (4.6). In this match Antrim’s productivity was reduced to 2.9 per 10 possessions, a clear indication that Donegal provided much greater defensive resistance than Fermanagh.
Figure 9: Productivity
Summary
In many areas Antrim were able to compete well with Donegal. Antrim’s possessions to scores ratios were comparable across the board with Donegal, and also their rate of turnovers was not significantly different. However, Donegal were able to secure the victory based upon their superior volume of possessions, their dynamism when in possession and ultimately their greater productivity.
Donegal’s success was built upon their greater volume of possessions which, based upon the evidence, came about as a result of their superior kick out strategy, as well as their greater ability to win contested kick outs. Donegal had clearly identified the short kick out as their preferred strategy, and this was essentially successful, resulting in 10 possessions won. They also were able to put significant pressure on the Antrim kick out strategy, the standout figure being the 14 possessions won via break ball from Antrim’s kick outs.
Donegal
There is no clear and obvious area for concern for Donegal ahead of the Ulster final in terms of one single area of their game play. What might be of concern is the disparity in their performance between the first half and second half. Their possession to scores ratio in the first half was only 22%, with the second half providing a stark contrast of 46%. Likewise their number of turnovers in the first half was 15, but a much improved second half figure of 8.
From a training perspective this is an interesting issue to address given that the issues are not specifically related to any game activity which can be addressed through a conditioned game or drills. It is also conceivable that this approach is not unexpected for Donegal, especially when we consider a very similar pattern emerged in their first round clash with Derry. Are Donegal specifically targeting certain time periods within a match to ‘turn the screw’ and increase work rate and intensity?
Antrim
Despite the margin of defeat, Antrim can still take a significant number of positives from this match. They are arguably the best team in the province at converting possessions to scores, having converted 39% versus Fermanagh and 29% in this match versus Donegal. They converted 55% of their shots taken in this match, so they are certainly economical in front of goal.
However, their issue in this game was securing sufficient possession to make the necessary impact on the score board. Donegal enjoyed 16 more possessions in this match, and it is fair to argue this deficit could be attributed solely to Antrim’s inability to secure possession from kick outs. They only won 40% of their own kick outs in this match, and lost a massive 14 via break ball. They competed even less on the Donegal kick out, winning only 21%, and seemingly conceding the short kick outs (10) without any strategy to compete.
Ahead of the forthcoming qualifier clash it is important that Antrim address their kick out strategy. They may have to consider the use of short kick outs on occasions, but they also need to address their ability to secure more break ball when the need arises. An improved strategy to combat opposition kick outs, in particular short kick outs, appears to be essential in their efforts to increase the volume of possession secured.
USFC 2014 – Summarised
Below is a selection of key aspects of game play from the 2014 USFC. It allows for comparison between the teams that have played to date across this range of key aspects.