Throughout the 2014 Ulster Senior Championship, Ulster GAA will be compiling a report of the key statistics from each match. The reports will look at a range of factors contributing to game play, including possession breakdown, kick out success, possession to scores ratios and turnover stats.
The purpose of this project is to identify the key differences between team performance, and possibly help pin point where the key differences existed. Ultimately, it is hoped to identify the key area each team needs to address ahead of their next championship outing in 2014.
Time in Possession
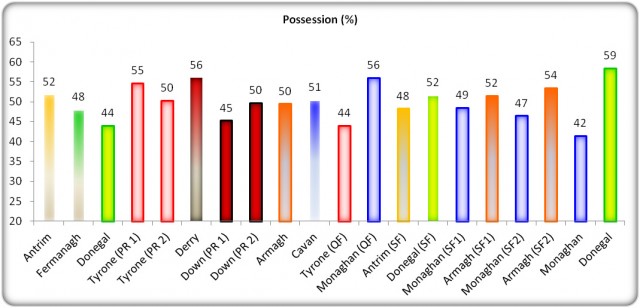
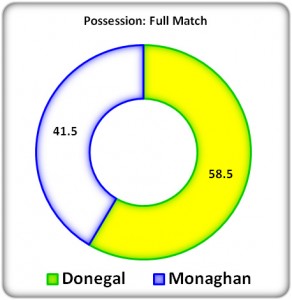
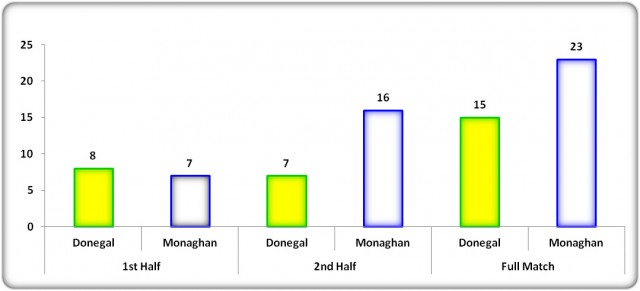
The Ulster final provided us with the first clear cut incidence of possession dominance in this year’s Ulster Championship, with Donegal enjoying 58% possession in the first half (Figure 1A) and 58.9% in the second half (Figure 1B). Not surprisingly, these figures resulted in Donegal enjoying the highest overall possession share of any team in the ten Ulster Championship matches of 2014, with 58.5% (Figure 2). Consequently, Monaghan’s 41.5% share was their lowest share in this year’s Ulster Championship.
Figure 1A & 1B: 1st & 2nd Half Possession
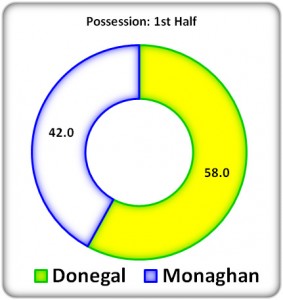

Figure 2: Full Match Possession
Possession to Scores Ratios
Despite a 17% advantage in terms of time spent in possession, Donegal actually had fewer possessions over the course of the match. Monaghan had 3 more possessions, 48 to Donegal’s 45 (Figure 4). On the basis of these figures it is interesting to observe the difference between the teams in terms of average time per possession (Figure 3). Donegal averaged 40 seconds per possession, while Monaghan only average 27 seconds per possession.
Figure 3: Time per Possession
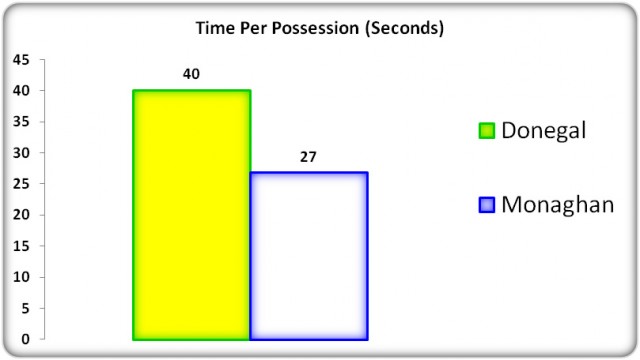
While there are no patterns evident to suggest that these figures point towards success in this particular match, it must be noted that Donegal averaged 34 seconds versus Derry, and 25 seconds against Antrim. All together this would suggest that Donegal employed a more patient approach to the final than in either of their games previously.
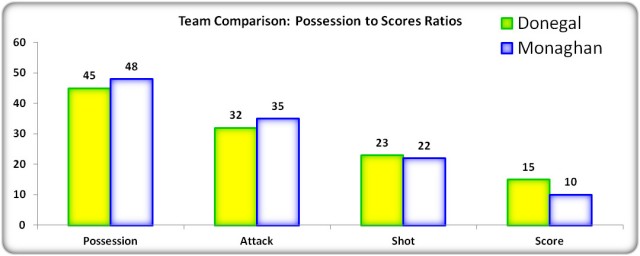
Both teams were equally adept at moving possessions into the attacking zones, with Monaghan slightly more effective, moving 73% of possessions to attacks, compared to Donegal’s 71%. Thereafter is where the different approaches manifested themselves with Donegal creating shooting chances from 72% of their attacks, while Monaghan only created shots from 63% of their attacks. It is possible that the extra average time spent in possession by Donegal is directly linked to their willingness to probe more patiently and eventually create the shooting chances.
While creation of shooting chances was one issue for Monaghan, their shot conversion rate only served to worsen the situation. Monaghan only converted 43% of their shots, while Donegal were much more emphatic, converting 65% of their shots taken.
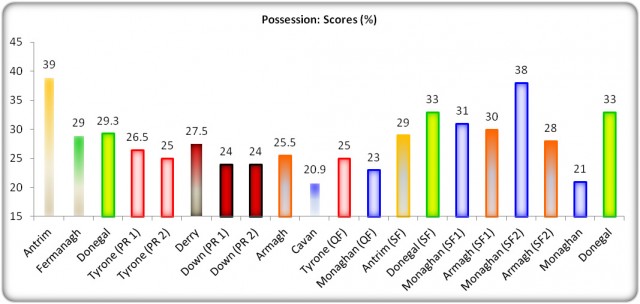
To summarise, Donegal converted 33% of their possessions to scores, while Monaghan only managed to convert 21% of possessions to scores. Donegal replicated their highest return which came versus Antrim, while Monaghan delivered their poorest return of this year’s Ulster Championship.
Figure 4: Possession : Scores Ratio
Kick Out Statistics
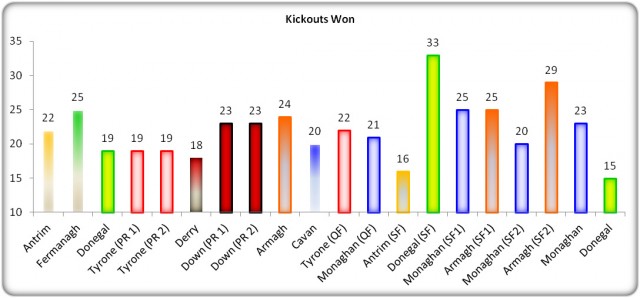
Prior to the final, Donegal were the more dominant team from kick outs. However, as we can see from figure 5, Monaghan were comfortably the more dominant team in the final. This provides an interesting situation. Despite winning over 60% of all kick outs, Monaghan had the lowest time in possession of any team in this year’s Ulster championship. This, perhaps, raises an important question, and certainly justifies the need for further investigation as to the actual importance of the kick out in games played this year.
Figure 5: Kick Outs Won
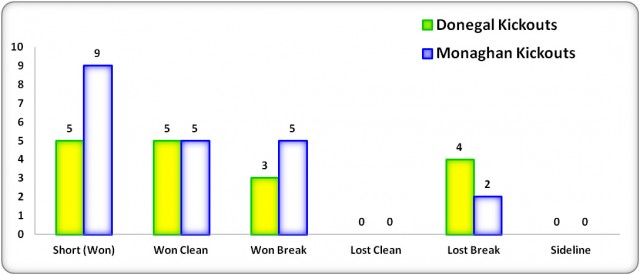
The dominance of the first three columns in figure 6, below, emphasises the dominance each team enjoyed from their own kick outs. Donegal won 13 from 17 of their own kick outs, a success rate of 76%, while Monaghan won 19 from 21 of their own kick outs, equating to a success rate of 90%. As previously alluded to, the importance of winning kick out possession appears to be subject to question in this year’s championship. This kick out breakdown provided further evidence that success from kick outs does not necessarily translate to victory, and, as witnessed in this game, does not even guarantee that a team will win the possession battle.
Figure 6: Kick Out Breakdown
Turnovers
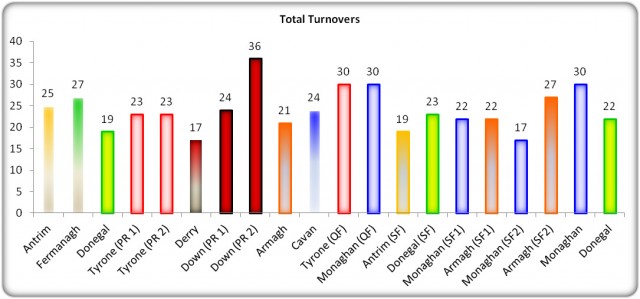
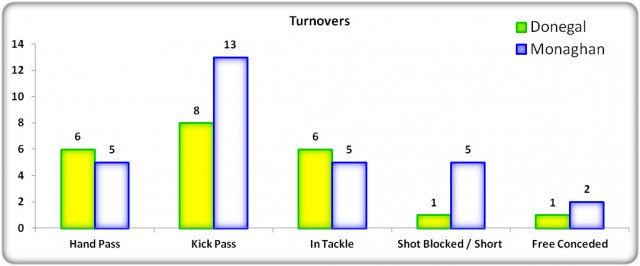
Given that Monaghan won the kick out battle, yet only enjoyed a marginal overall success in terms of overall number of possessions, it is fair to assume that Monaghan coughed up significantly more turnovers over the course of this match. Figure 7 confirms that to be the case, with Monaghan losing 30 turnovers to Donegal’s 22.
The key differences between the teams lay in the volume of possession lost through wayward kick passing and more worryingly for Monaghan the 5 shots which fell short. This total of 5 shots short has been a consistent figure for Monaghan throughout the championship. While impacting on their volume of turnovers it is also having an effect on their shot conversion figures.
Figure 7: Turnovers
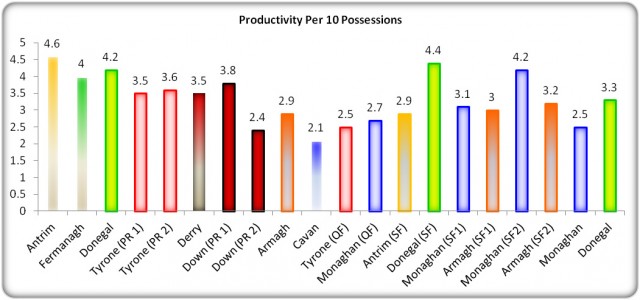
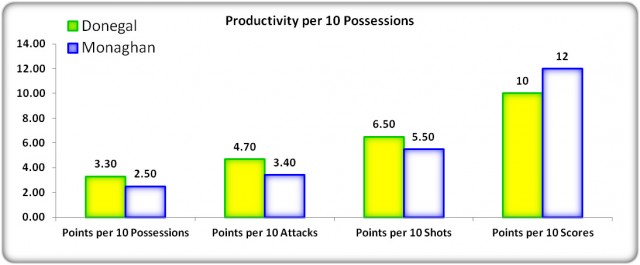
Not surprisingly Donegal were the more productive of the 2 teams, delivering an average of 3.3 points per 10 possessions, compared to just 2.5 points per possession for Monaghan. In fact, the only poorer performance’s of the championship than Monaghan’s were Down versus Tyrone in the replayed fixture (2.4) and Cavan against Armagh (2.1).
To their credit, Monaghan were able to reduce Donegal’s productivity to well below their previous average of 4.3 for this year’s championship. Unfortunately, their own return of 2.5 was also well below their own average of 3.3 in their 3 matches prior to the final.
Figure 8: Productivity
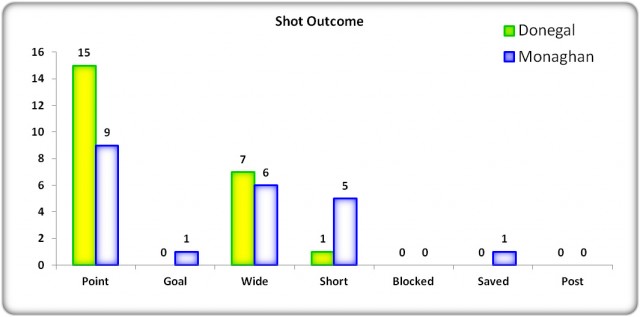
Assessing shot outcome is of crucial importance, in particular from a Monaghan perspective. In fact, Donegal only had 8 unsuccessful shots over the course of this match. Monaghan were not particularly wasteful with their opportunities either, having only failed to score with 12 shots. However, the number falling short continues to be an issue. Given the final score line it is fair to say that the shots falling short made a huge difference to the outcome of this match.
Figure 9: Shot Outcome
Summary
The key difference between the teams this week lay in their productivity when they did have possession. Despite having fewer possessions over the course of the game Donegal delivered 5 more scores, returning a possession to scores success rate of 33%, while in contrast Monaghan only returned a conversion rate of 21%. It is also crucial to note that Monaghan (22) did have only one less shot than Donegal (23).
Possession statistics highlight that Monaghan, if anything, were dominant from kick outs, winning over 60% of all kicks, and a huge 90% of their own kick outs. However, this dominance was undone by 8 more turnovers, 4 of which were due to shots falling short.
When we combine productivity and turnover statistics it becomes clear that the singular key difference that led to the Donegal victory was the number of shots that Monaghan dropped short. Not only were these unsuccessful shots, but they also handed possession directly to Donegal who were then able to launch an immediate counter attack. In this case, 4 of these possessions did not amount to anything, however, the last Monaghan shot dropped short led directly to a Donegal point. This is effectively a turnaround of 2 points. Given the 3 point margin of victory it is clear to understand why teams cannot afford to drop shots short.
Monaghan
Undoubtedly, Monaghan will again be keen to address the volume of shots dropped short. They have averaged 5 shots short or blocked throughout their 4 matches, and this game more than any other emphasised the problem this can cause in attempting to secure a victory.
As well as some poor finishing, Monaghan lost a significant amount of possession (13) through stray kick passing, and will need to reduce this ahead of their meeting with Kildare. If we take into account the average time per possession, Donegal (40 seconds) appeared a lot more patient in possession than Monaghan (27 seconds). While this approach does not suit all matches and opponents, in this particular match up it is fair to suggest that it was a big factor, with Monaghan appearing more willing to kick long ball to players who were outnumbered and thus turned possession over.
There are certainly positives for Monaghan to build upon ahead of their clash with Kildare, with their dominance of the kick out battle the main factor to be satisfied with. They claimed 90% of their own kick outs, a total of 19 from 21 kicks. Add to this that only 9 of these were short kick outs, they claimed a total of 10 kick outs when played long into the more congested areas of the pitch. They also limited Donegal to just 5 short kick outs.
Donegal
Donegal move on to meet the winners of the Armagh Meath qualifier and they will no doubt look to improve once again on their performance from the Ulster Final. While their productivity of 3.3 points per 10 possessions is comparable with the overall Ulster Championship average they may feel they want to return this output towards their own average of 4.3 which they delivered prior to the final.
It would appear in this match that they struggled to progress possession into the attacking zone with the same regularity as in previous matches, likewise they struggled to create shooting chances more so than in their previous matches. What they did manage to do was increase their shot success rate, which compensated for their struggles in the others build up areas. Donegal will be searching for the form that will see them create shooting chances as frequently as in previous rounds while also maintain their shot success rate from the final.
Donegal may also have to target the opposition kick out and attempt to apply greater pressure going forward. Allowing opponents to claim 90% of their own kick outs is a dangerous chance to take, and could be undone should a team prove to be extremely efficient when in possession.
USFC 2014 – Summarised
Below is a selection of key aspects of game play from the 2014 USFC. It allows for comparison between the teams that have played to date across this range of key aspects.