Statistical Analysis of Monaghan v Tyrone
Throughout the 2014 Ulster Senior Championship, Ulster GAA will be compiling a report of the key statistics from each match. The reports will look at a range of factors contributing to game play, including possession breakdown, kick out success, possession to scores ratios and turnover stats.
The purpose of this project is to identify the key differences between team performance, and possibly help pin point where the key differences existed. Ultimately, it is hoped to identify the key area each team needs to address ahead of their next championship outing in 2014.
Ball in Play
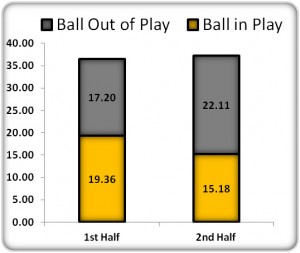
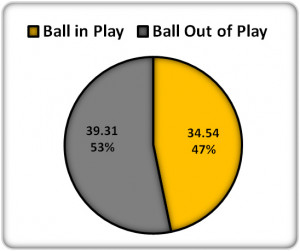
This information is of particular interest this week, based largely on the controversy in the aftermath of this match surrounding the amount of stoppage time played. Overall, there was an active game time of 34 minutes, 54 seconds (47%), which, based upon the 2014 championship is a fairly average standard of playing time. On this basis it would appear that there is little evidence to support any argument relating to inadequate stoppage time being added.
However, when we look in more detail, there was only 15 minutes and 18 seconds (40.5%) of active time in the second half and this is the period around which any issues were raised. One of the key reasons for lower playing time appears to lie in the number of fouls committed in the second half, a total of 24, compared to just 19 in the first half. In total Tyrone committed 26 fouls to Monaghan’s 18. Both teams committed a total of 12 in the second half. Ultimately the time ‘wasted’ following the award of these frees limited the active game time in the second half. It is worth noting that while the perception may have been that Monaghan were the perpetrators, on 2 occasions during the second half Tyrone consumed over 50 seconds in order to take free kicks (54 & 56 seconds). That said, on at least one other occasion there was a stoppage of 47 seconds for the referee to issue a black card following a foul.
Figure 1A & 1B: Active Game Time
Possession
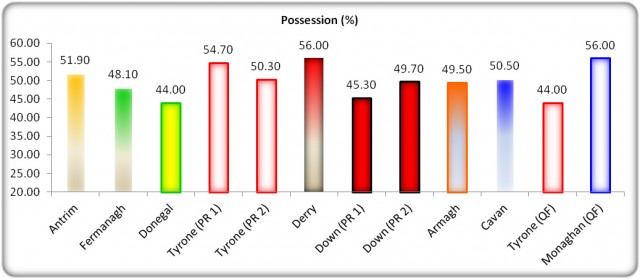
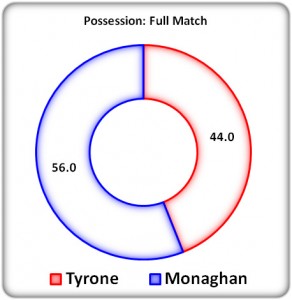
Over the course of this game, Monaghan were able to dominate possession, emerging with 12% superior share. In the first half they had almost 15% more possession when compared to Tyrone. Despite this impressive superiority they only enjoyed a minimal half time advantage, leading 8 points to 7. The argument at half time would have been that more Tyrone possession could result in overhauling the deficit. What transpired would also support this theory. Tyrone increased their share of possession in the second half, albeit Monaghan still had almost 10% more. The second half finished all square, which from Tyrone’s point of view was not sufficient to overhaul the first half deficit. In theory, Tyrone probably required another 5% of the possession to have converted to a victory.
Figure 2A & 2B: 1st & 2nd Half Possession
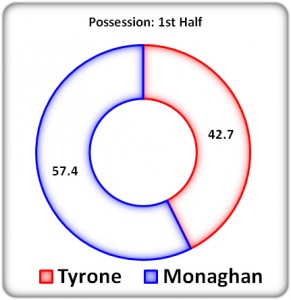
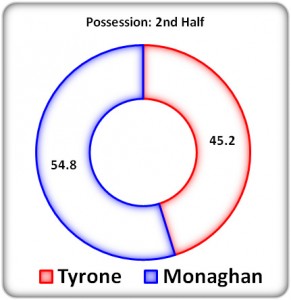
Figure 3: Full Match Possession
Kick Out Statistics
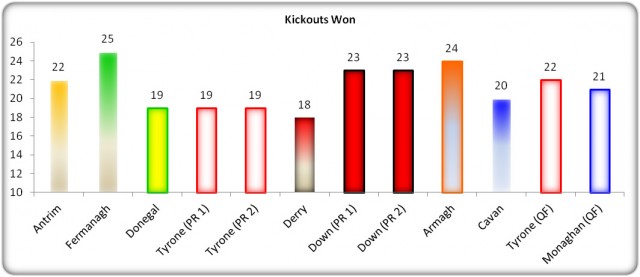
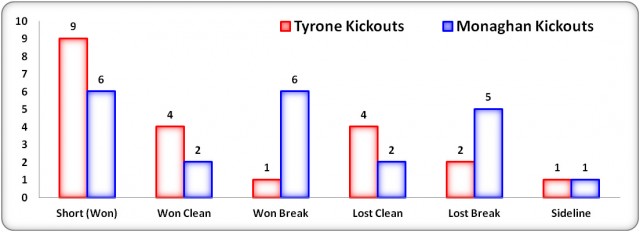
Given Monaghan’s superior time spent in possession it would have been expected that they had won more kick out possession. However, as evident in figure 4, the kick outs were not the source of Monaghan’s superior possession, with Tyrone shading this battle.
Figure 4: Kick Outs Won
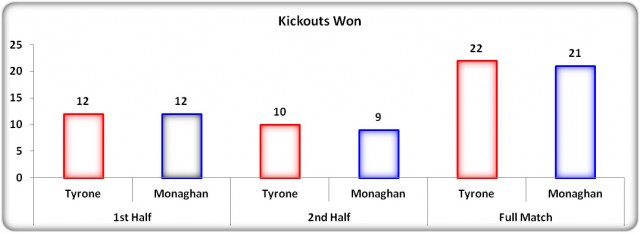
When broken down, there is little to separate the teams, with Tyrone winning 14 from their own 21 kick outs (67%) and Monaghan claiming 14 from their 22 kick outs (64%). Once again, both teams showed a preference for employing the short kick out option, with Tyrone playing 9 short kicks to Monaghan’s 6. Both teams will be keen to tidy up on some of the kick outs statistics from their own kicks, with Tyrone losing 4 of their own kicks cleanly, while Monaghan lost 5 of their kicks via break ball. It is worth pointing out that neither number is overly high, but given how difficult it is to secure possession at this level, both teams would like to reduce the chances they present to their opponents going forward.
Figure 5: Kick Out Breakdown
Turnovers
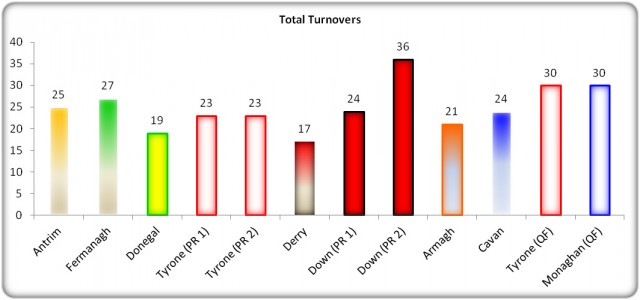
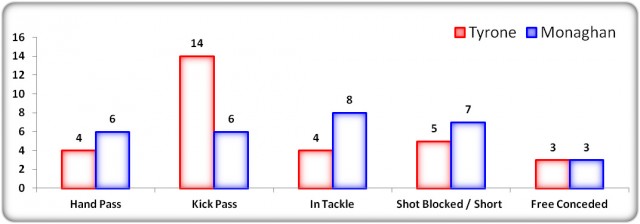
The tight nature of this contest is also evident in the number of turnovers for each team. Over the course of the match each team lost possession on 30 occasions (Figure 6). These totals are the highest to date in the championship with the exception of Down in the replay versus Tyrone (36). While Tyrone will be aiming to reduce the volume of stray kick passes, Monaghan will want to address the volume of possession lost in the tackle ahead of their semi final clash with Armagh. The number of possessions lost through short or blocked shots will be an issue that both will be keen to reduce.
Figure 6: Turnovers
Possession to Scores Ratios
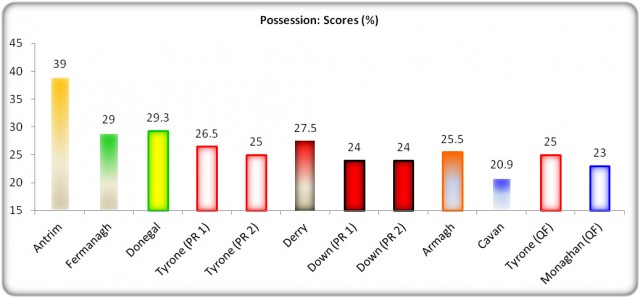
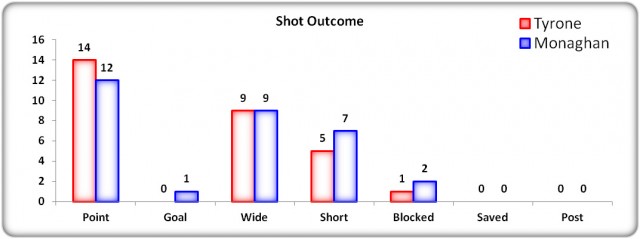
This is yet another statistic that demonstrates the closeness of this match. Despite the greater possession share in terms of time, Monaghan only enjoyed the same number of possessions as Tyrone over the course of the game (Figure 7A). Both were equally adept at converting possessions into attacks (68%), with Monaghan edging the shot count (Monaghan – 31, Tyrone, 29). Tyrone were slightly more clinical, converting 48% of their shots, and Monaghan 42%. Both teams will be relatively happy with their shot success rate. However, both might point to the relatively low 68% of possessions converted to attacks as an area to address. It is important to consider the turnover count and understand that the intensity of tackling throughout the pitch likely contributed to difficulty for both teams in terms of generating attacks. On the flip side, both will point to their defensive efforts and be content that they were able to apply sufficient pressure to cause problems for their opponents.
Neither team had a particularly high amount of wides (9 each), but both will certainly look to the number dropped short or blocked as an issue. Considering the emphasis placed on ensuring shots go dead and avoiding allowing the opposition to break quickly both will certainly look to reduce this count as the championship progresses.
Figure 7A & 7B: Possession to Scores Ratios & Shot Outcomes

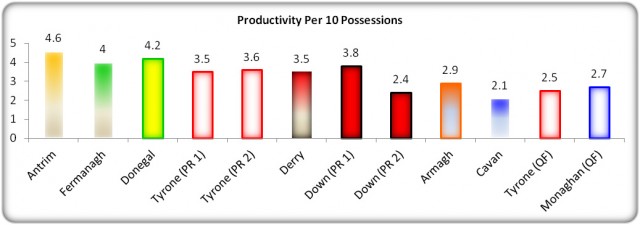
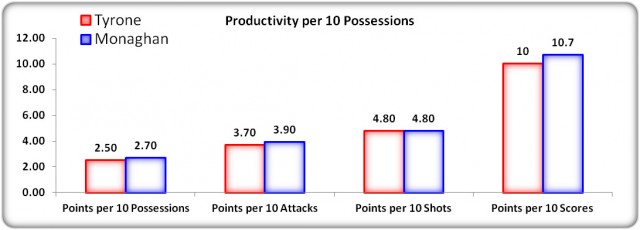
Despite the closeness of this game on many fronts, there was one crucial factor separating the teams. As alluded to earlier in the championship, we cannot undervalue the goal when considering our stats. Ultimately, through scoring a goal Monaghan ensured they were the more productive team (Figure 8). What is key in any match is to be more productive than the opposition, which Monaghan managed. They also succeeded in reducing Tyrone’s return from 3.6 (replay v Down) to 2.5 points per 10 possessions. Despite not producing an overly productive afternoon themselves (2.7), Monaghan did manage to limit Tyrone’s productivity sufficiently in order to emerge victorious.
Figure 8: Productivity
Summary
Despite Monaghan spending a significantly greater time in possession, this game was evenly balanced on all other fronts, including number of possessions, numbers of attacks and turnovers. Any advantages in other areas were marginal, and offer little clues as to the reason for Monaghan’s victory. Given that Monaghan enjoyed more time in possession, it would suggest that they were more patient in their build up play, with Tyrone attempting to be more direct. The turnover breakdown would support this notion, with Tyrone losing 14 balls via attempted kick passes, when compared to only 6 by Monaghan. Likewise, Monaghan’s patient approach got them into trouble in the tackle twice as much as Tyrone (8 to 4). Ultimately, the outcome of this game came down to the fact that Monaghan could be considered slightly more productive, returning 2.7 points per 10 possessions, compared to 2.5 for Tyrone. This is another endorsement for the importance of capitalising on goal scoring chances in championship football.
Tyrone
The disappointment in this result for Tyrone may lie in the time that they feel was not added on at the end of the second half. Despite the fairly low playing time in the second half they must focus on the multitude of stoppages which contributed to this, for which both teams and officials were responsible. A particular focus could be placed on the time required to take scorable free kicks, with 2 in the second half alone running down almost 1 minute of time each.
Tyrone will have many positives from this game, from a statistical point of view, with so many marginal battles. They won the majority of their own kick outs, with their short kick outs working well once again. They broke even in terms of number of possessions. They forced Monaghan into coughing up possession 30 times over the game. And they also reduced Monaghan’s productivity to 2.7 points per 10 possessions; only Down and Cavan registered lower productivity prior to this match.
Monaghan
Monaghan will be delighted to have secured this victory, but will surely not ignore that fact that there are several areas that they could aim to improve ahead of the semi final clash versus Armagh. They will certainly be keen to address better use of possession; given that they had almost 12% more time in possession than Tyrone. In particular the loss of possession in the tackle 8 times, and a count of 7 shots short or blocked. Combined, this amounts to 15 turnovers, exactly half of the possession coughed up over the course of the game.
Defensively Monaghan will be very satisfied to have reduced Tyrone’s productivity from 3.6 in their previous match to just 2.5 in this match. In both Tyrone’s matches versus Down their ability to score goals ensured they we very productive, but Monaghan were able to negate the goal scoring threat of Tyrone. At the same time, their own ability to convert the goal chance when it arose proved crucial to the outcome of the match.
USFC 2014 – Summarised
Below is a selection of key aspects of game play from the 2014 USFC. It allows for comparison between the teams that have played to date across this range of key aspects.
